-
PSA Backlog Dashboard
This optional dashboard highlights your backlog with a clear view of both scheduled and unscheduled items, pulling data by default from the current fiscal year. It offers an at-a-glance perspective to keep teams aligned on what’s planned and what still needs attention. Beyond backlog KPIs, the dashboard drills deeper into project status, booking value, billable hours, and unscheduled revenue, giving you a complete picture to manage resources and forecast more accurately.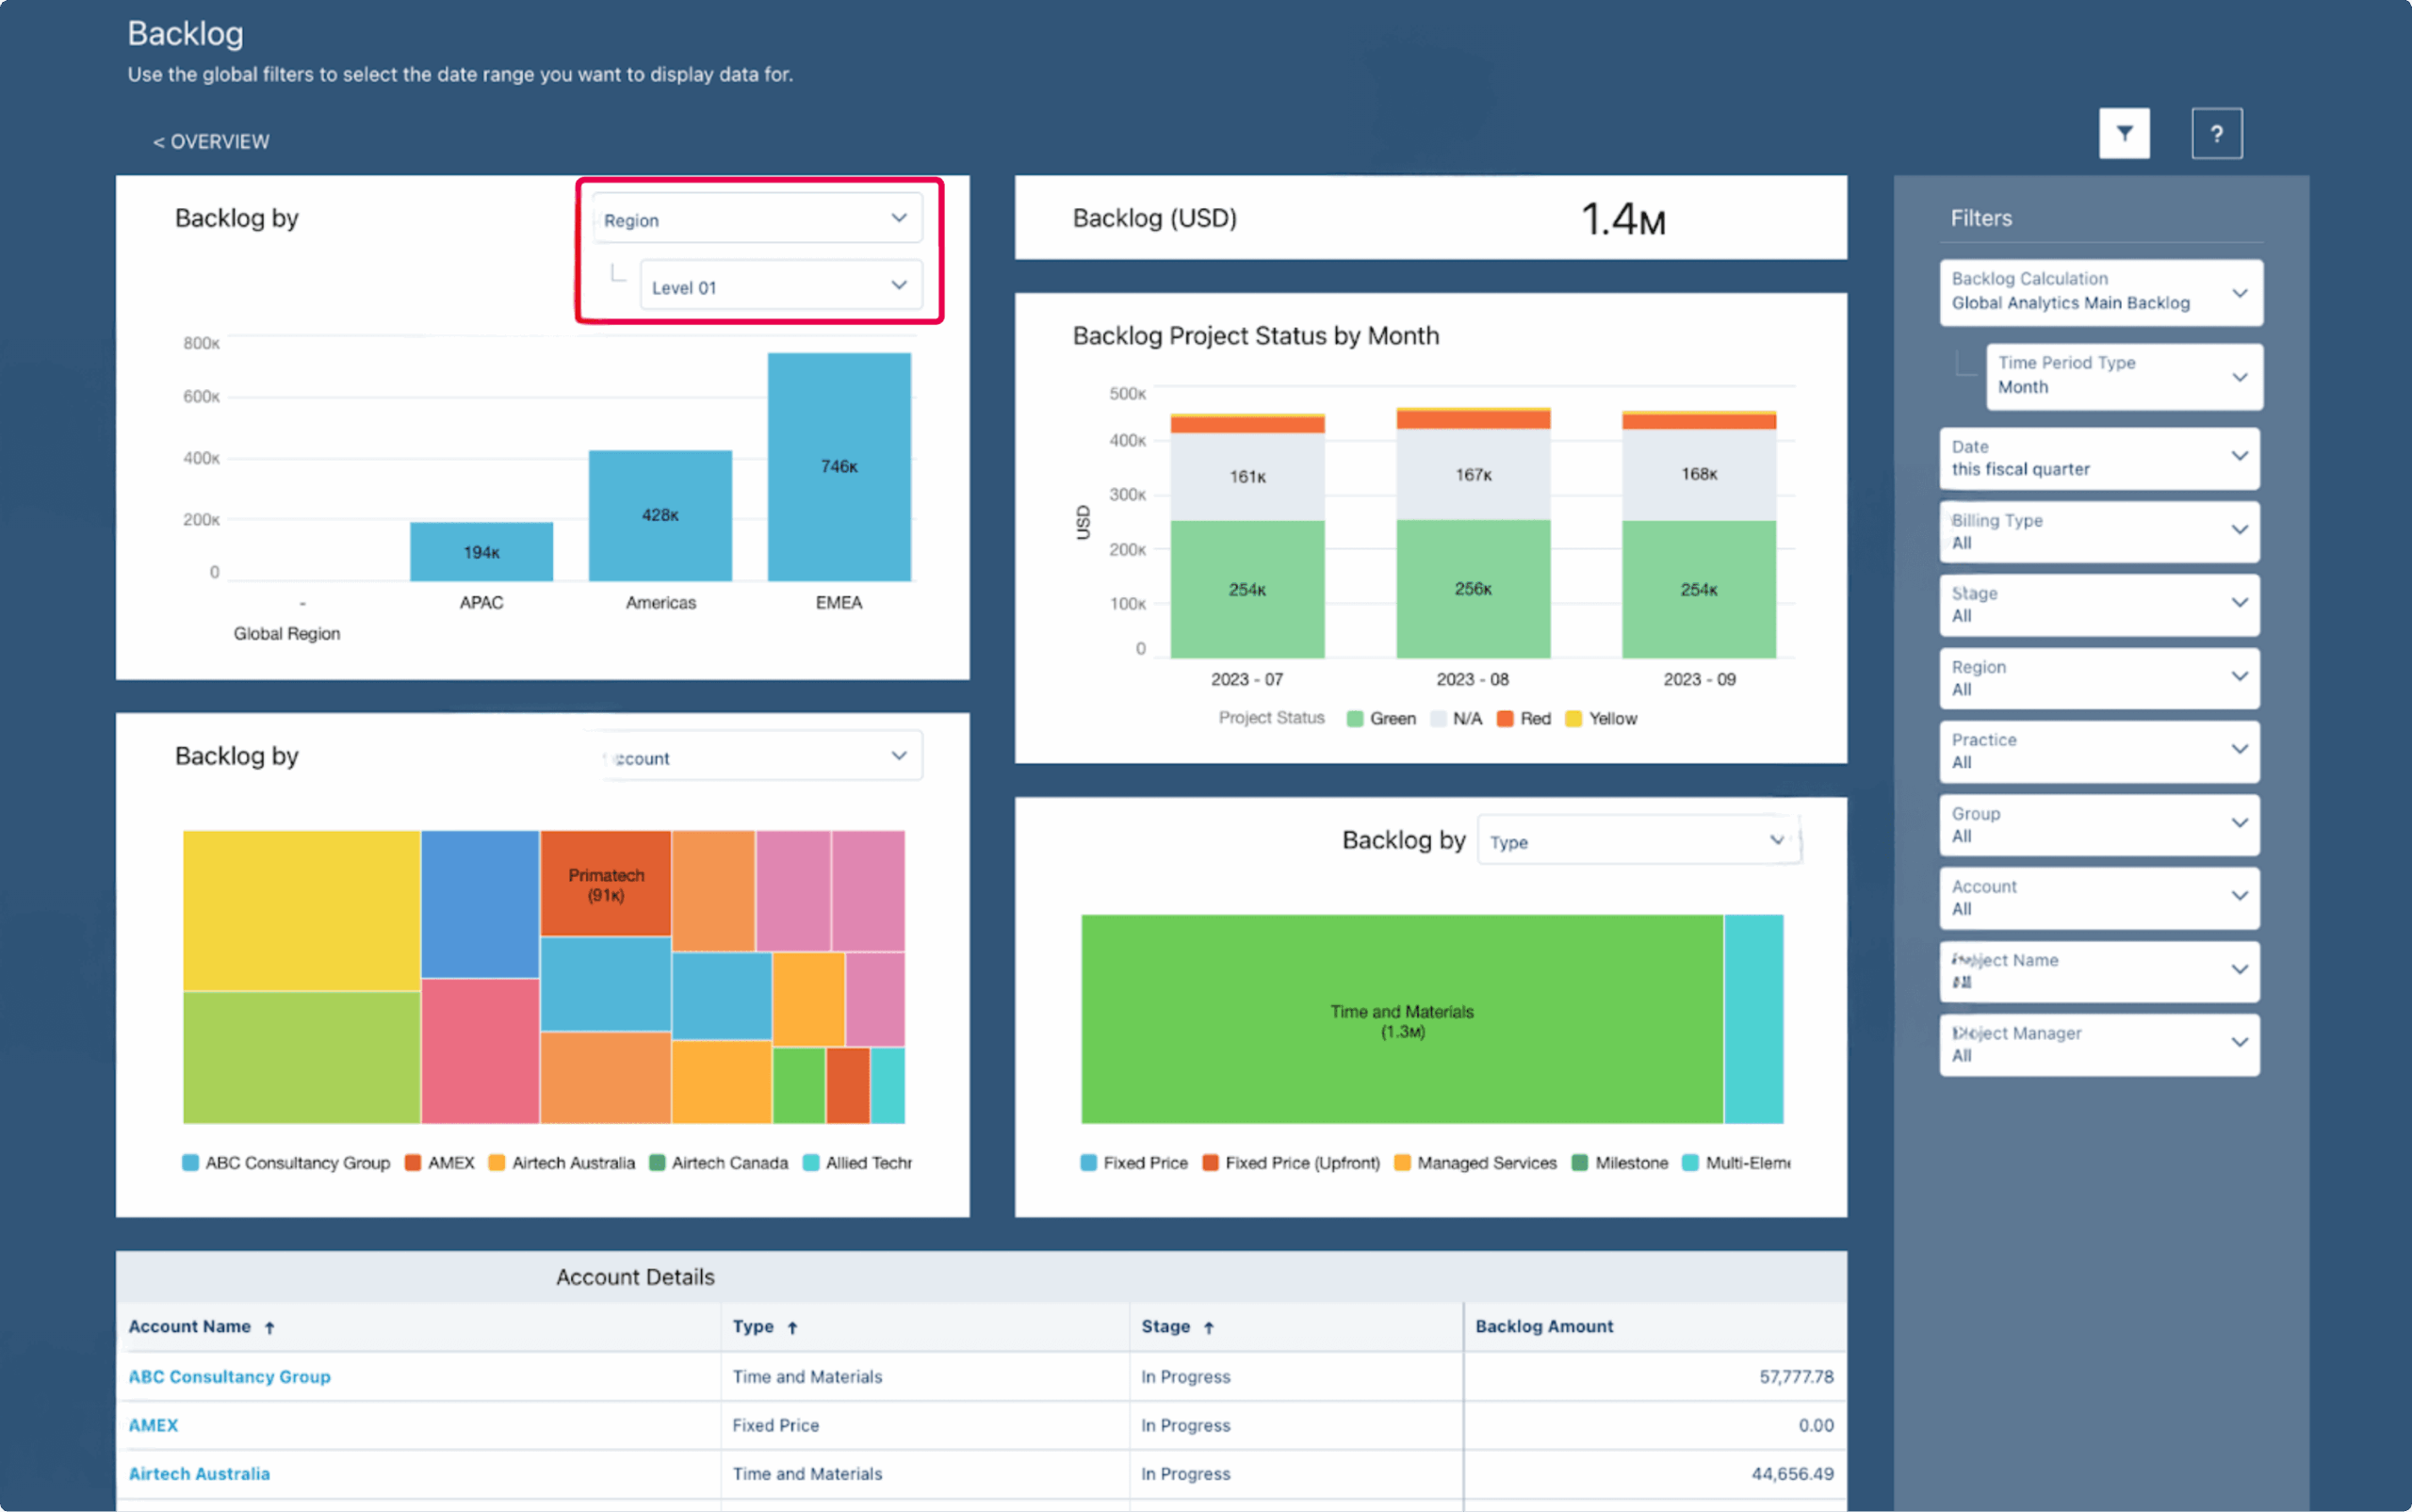
PSA Backlog Dashboard
-
PSA Billings Dashboard
This dashboard draws from the Billings dataset and defaults to the current fiscal year, giving you a clear picture of financial performance. It allows you to track KPIs for both scheduled and actual billings while also reviewing historical billing trends and comparing them with scheduled projections for the same period. In addition, it provides a detailed analysis of bill rates across all service activities, including both fixed-fee and time-and-materials work, helping you better understand revenue patterns and profitability.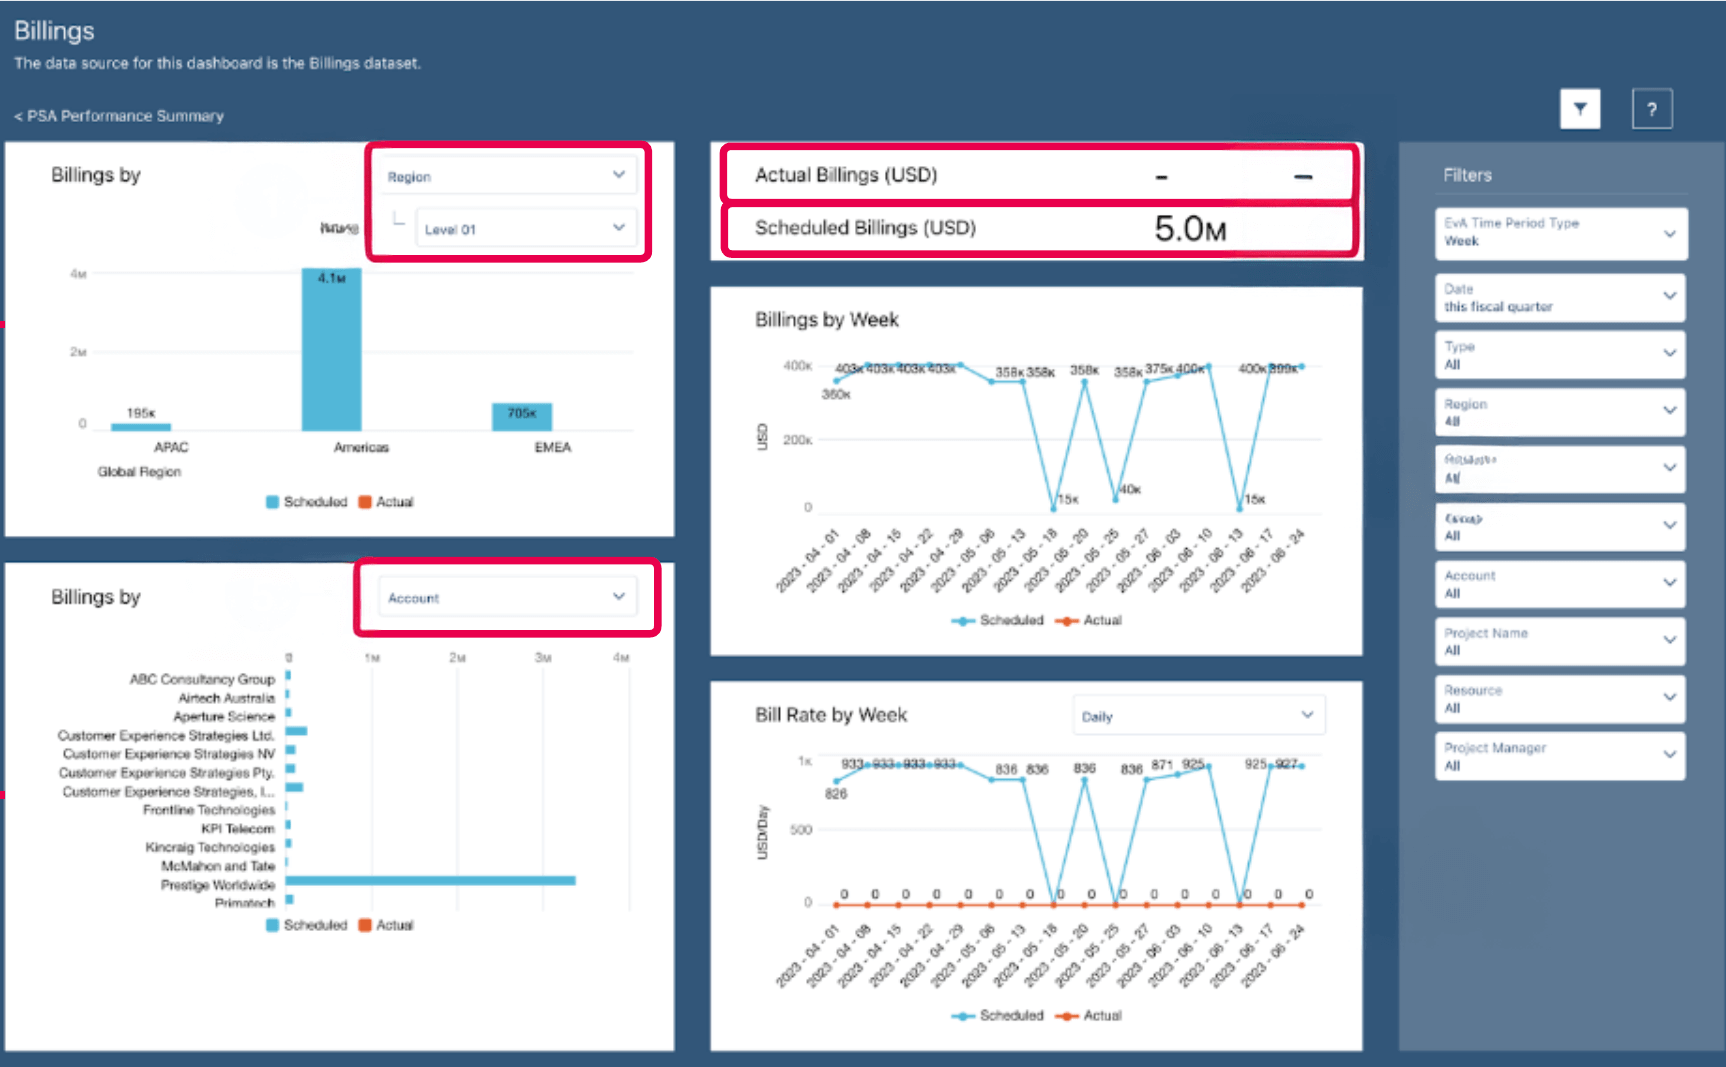
PSA Billings Dashboard
-
PSA Capacity and Demand Planning Dashboard
As part of the PS Cloud Advanced Analytics app, this dashboard leverages capacity datasets to show whether you have the right resources to meet demand, including pending requests. It highlights how demand affects capacity by role and helps you allocate resources more effectively across regions and practice groups. You can drill down further to view a detailed capacity breakdown for a selected date, covering assigned, held requests, unheld requests, and available capacity. The dashboard also lets you track resources and capacity hours over a chosen date range and access detailed resource information directly in PSA for better planning and decision-making. -
PSA Capacity Dashboard
This dashboard, built on the Capacity dataset, provides a clear view of resource allocation with default data from the current fiscal year. It allows you to analyze details by region, practice, and group, helping you stay aligned with organizational priorities. With this view, you can track KPIs such as scheduled hours and remaining hours percentage, monitor PSA scheduled utilization, and calculate total capacity hours. The data can also be grouped to reveal remaining resource availability, making it easier to plan and optimize workloads.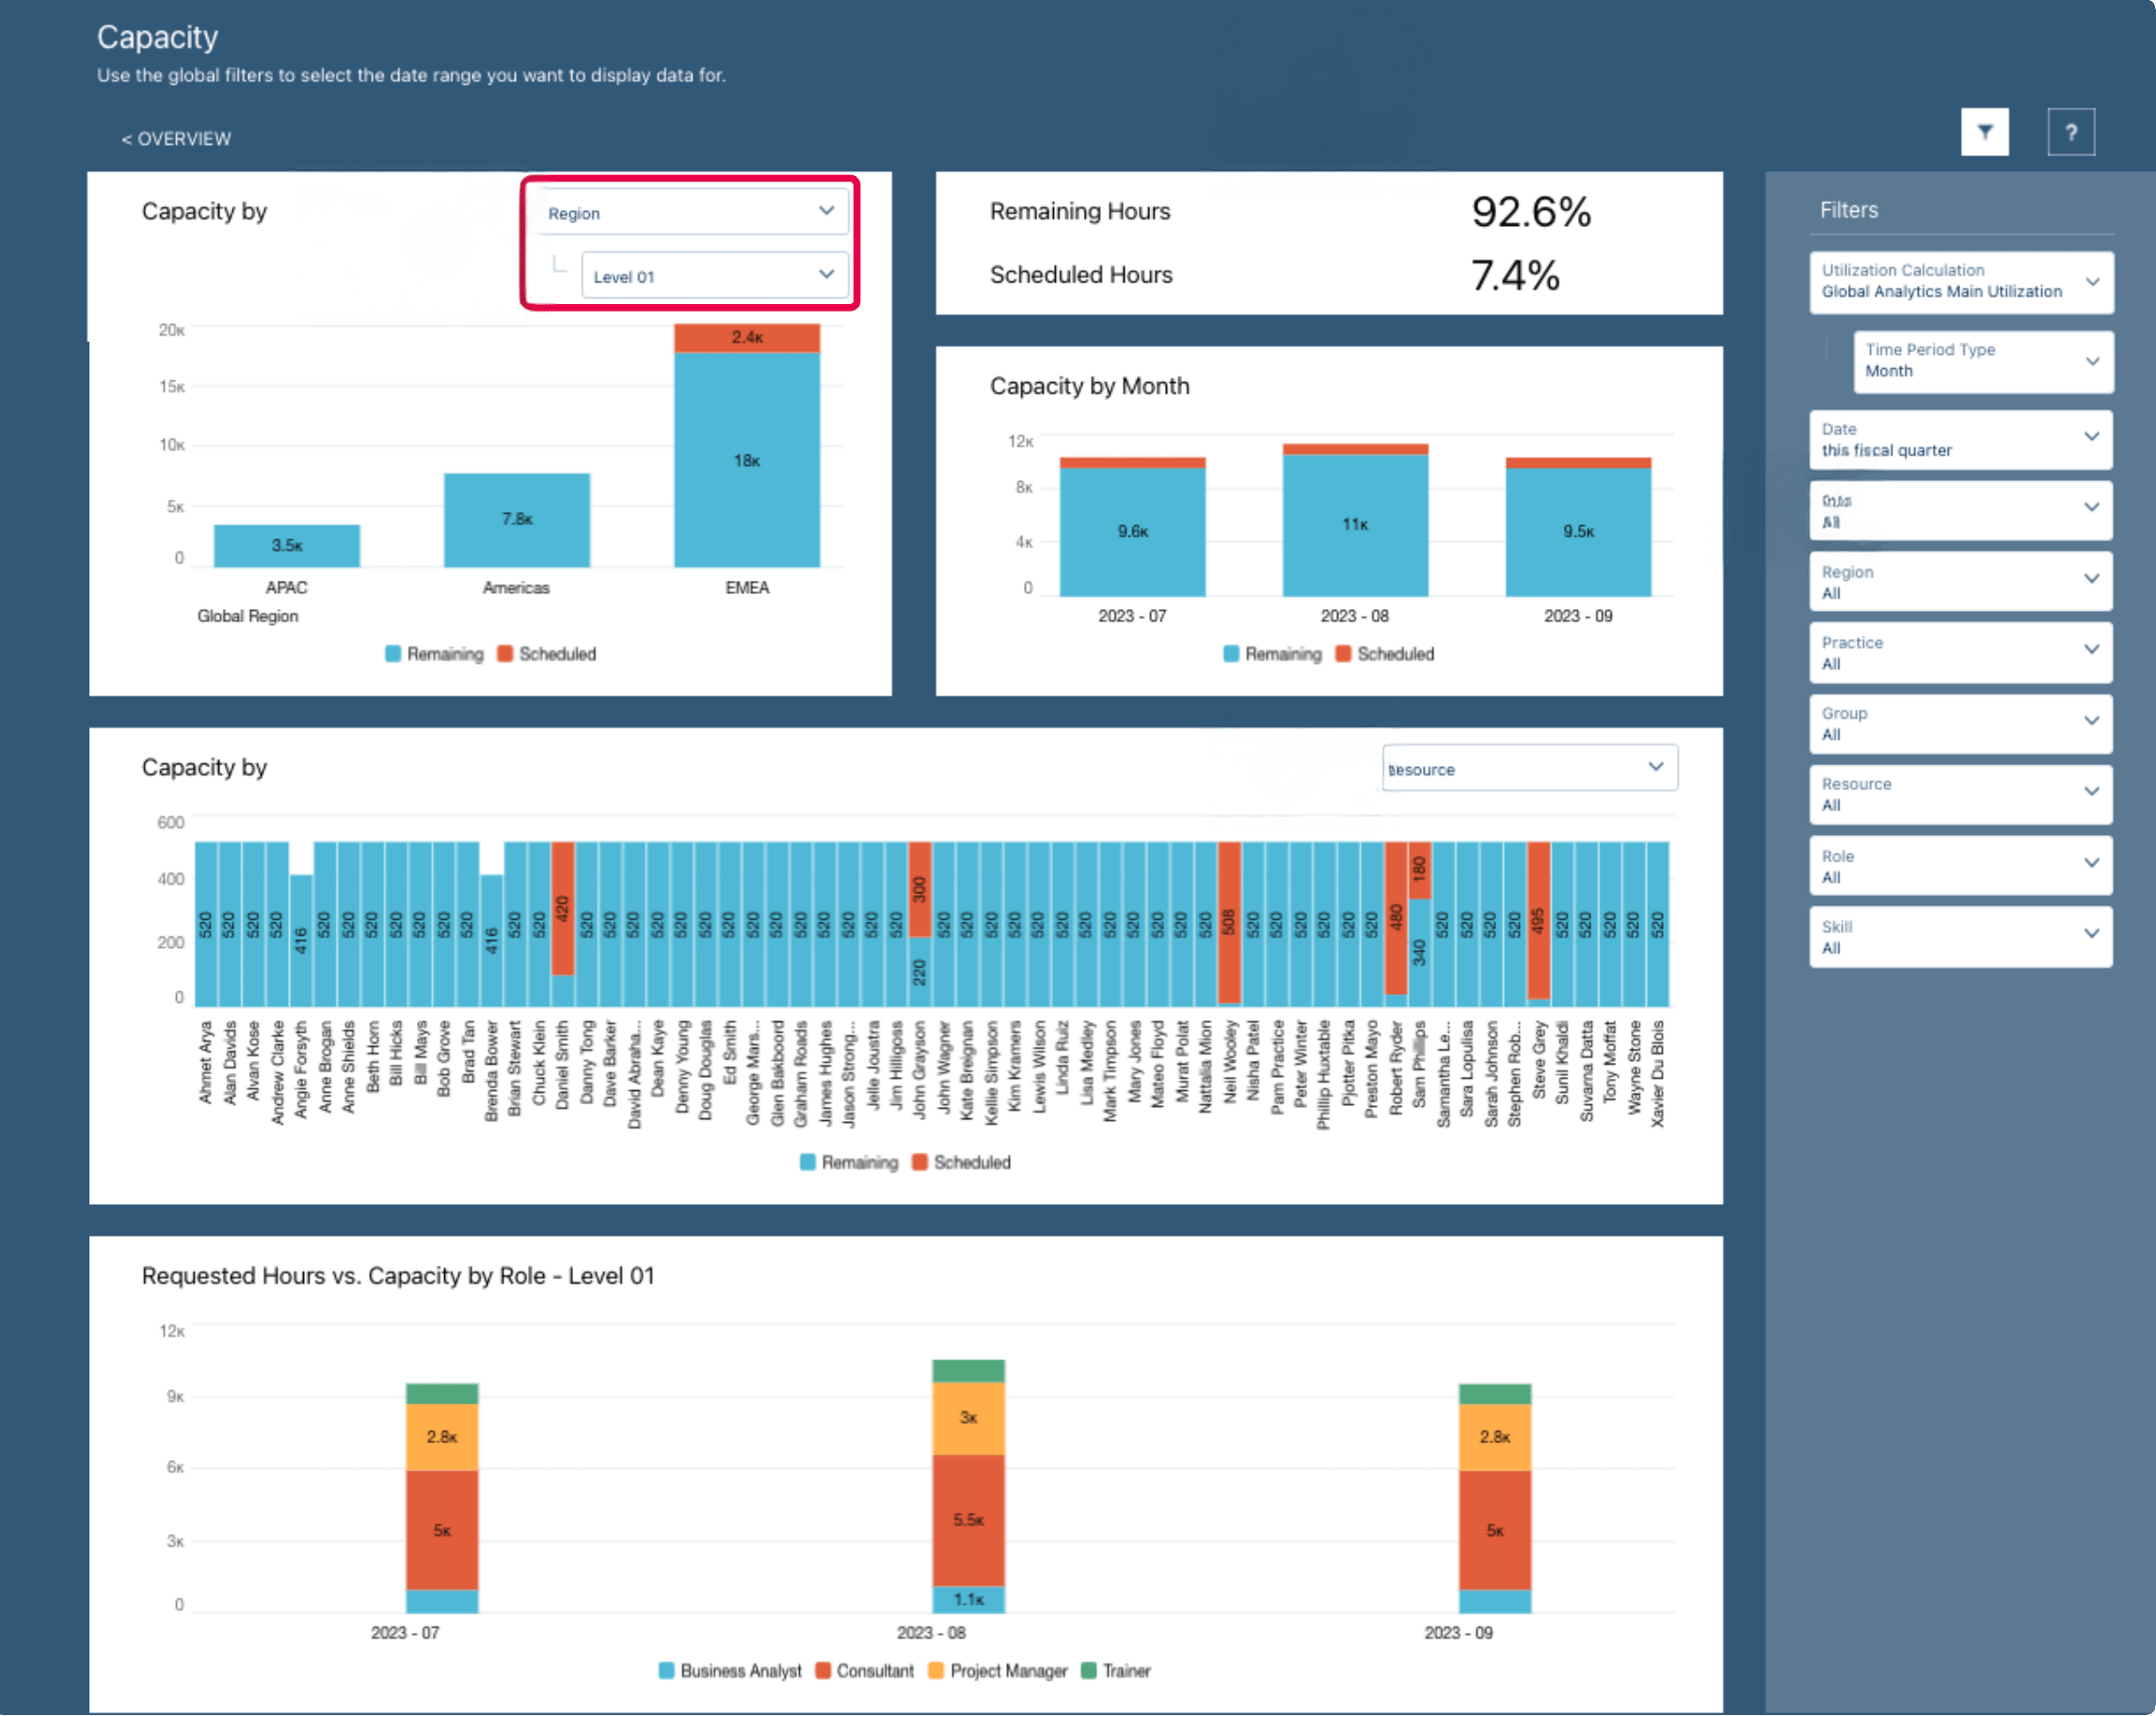
PSA Capacity Dashboard
-
PSA Capacity Summary Dashboard
This dashboard leverages the Utilization Results dataset, with the current fiscal year set as the default view. It provides visibility into resource details across region, practice, and group, giving you a focused look at how utilization aligns with business needs. Through this dashboard, you can track KPIs such as scheduled hours and remaining hours percentage, monitor PSA scheduled utilization, and calculate total capacity hours. You can also group the data to assess capacity availability, making it easier to balance workloads and optimize resource planning.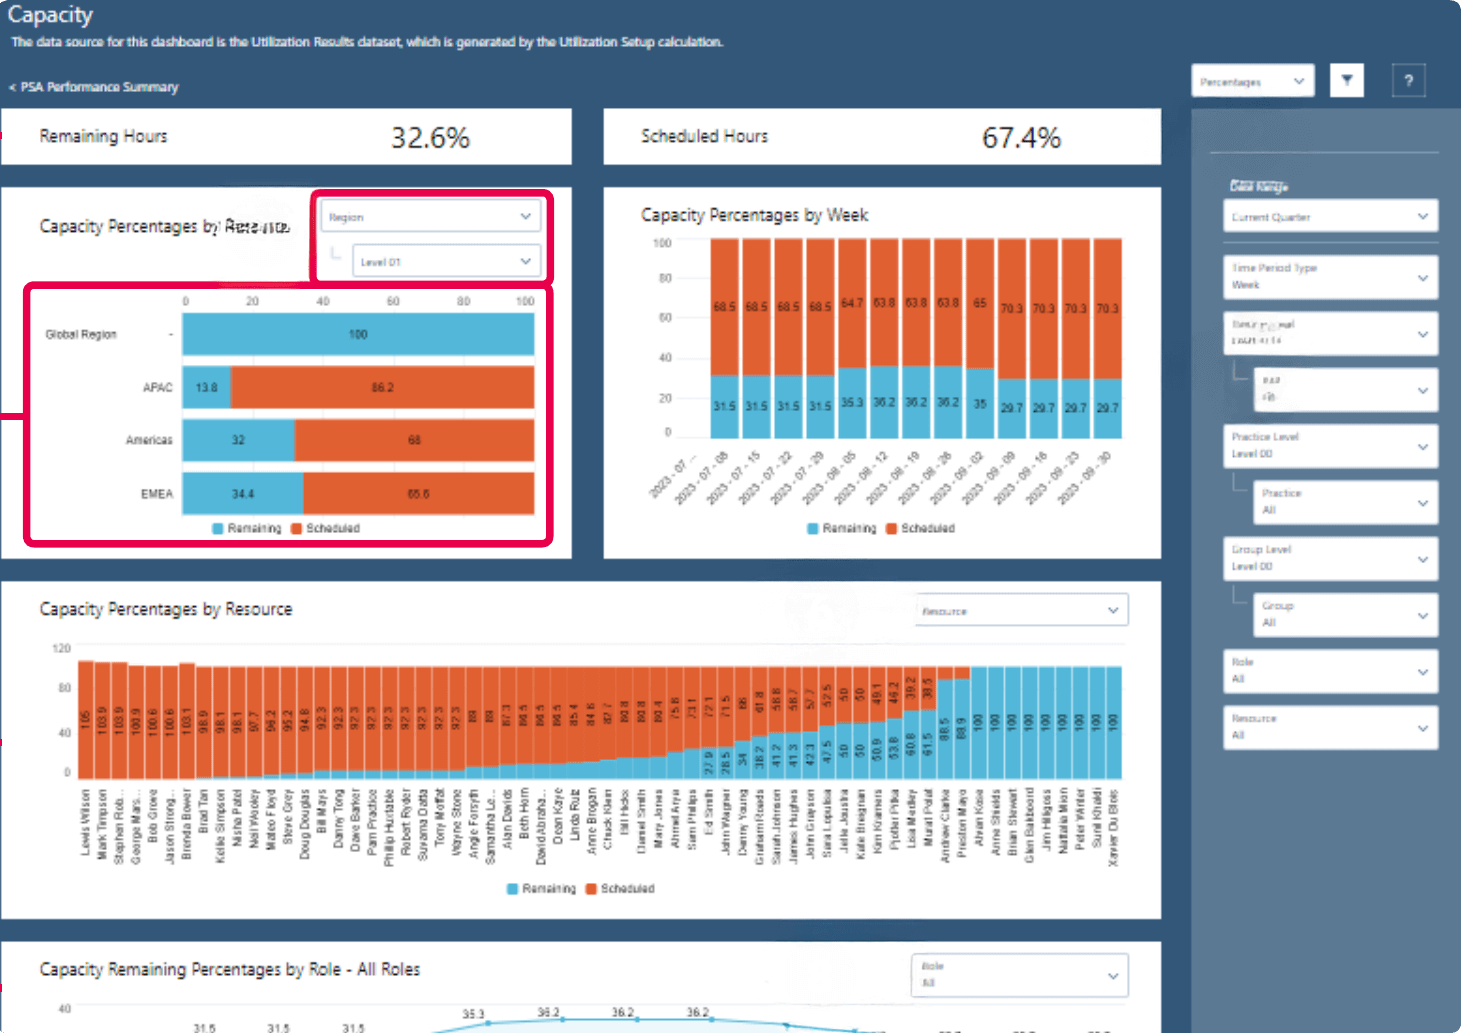
PSA Capacity Summary Dashboard
-
PSA Overview Dashboard
The PSA Overview Dashboard in PS Cloud Analytics provides a summary of key KPIs alongside visual graphs that highlight business trends. Depending on the optional data selected, it can display insights from either the Backlog or Revenue Forecast datasets, giving you a flexible view of overall performance.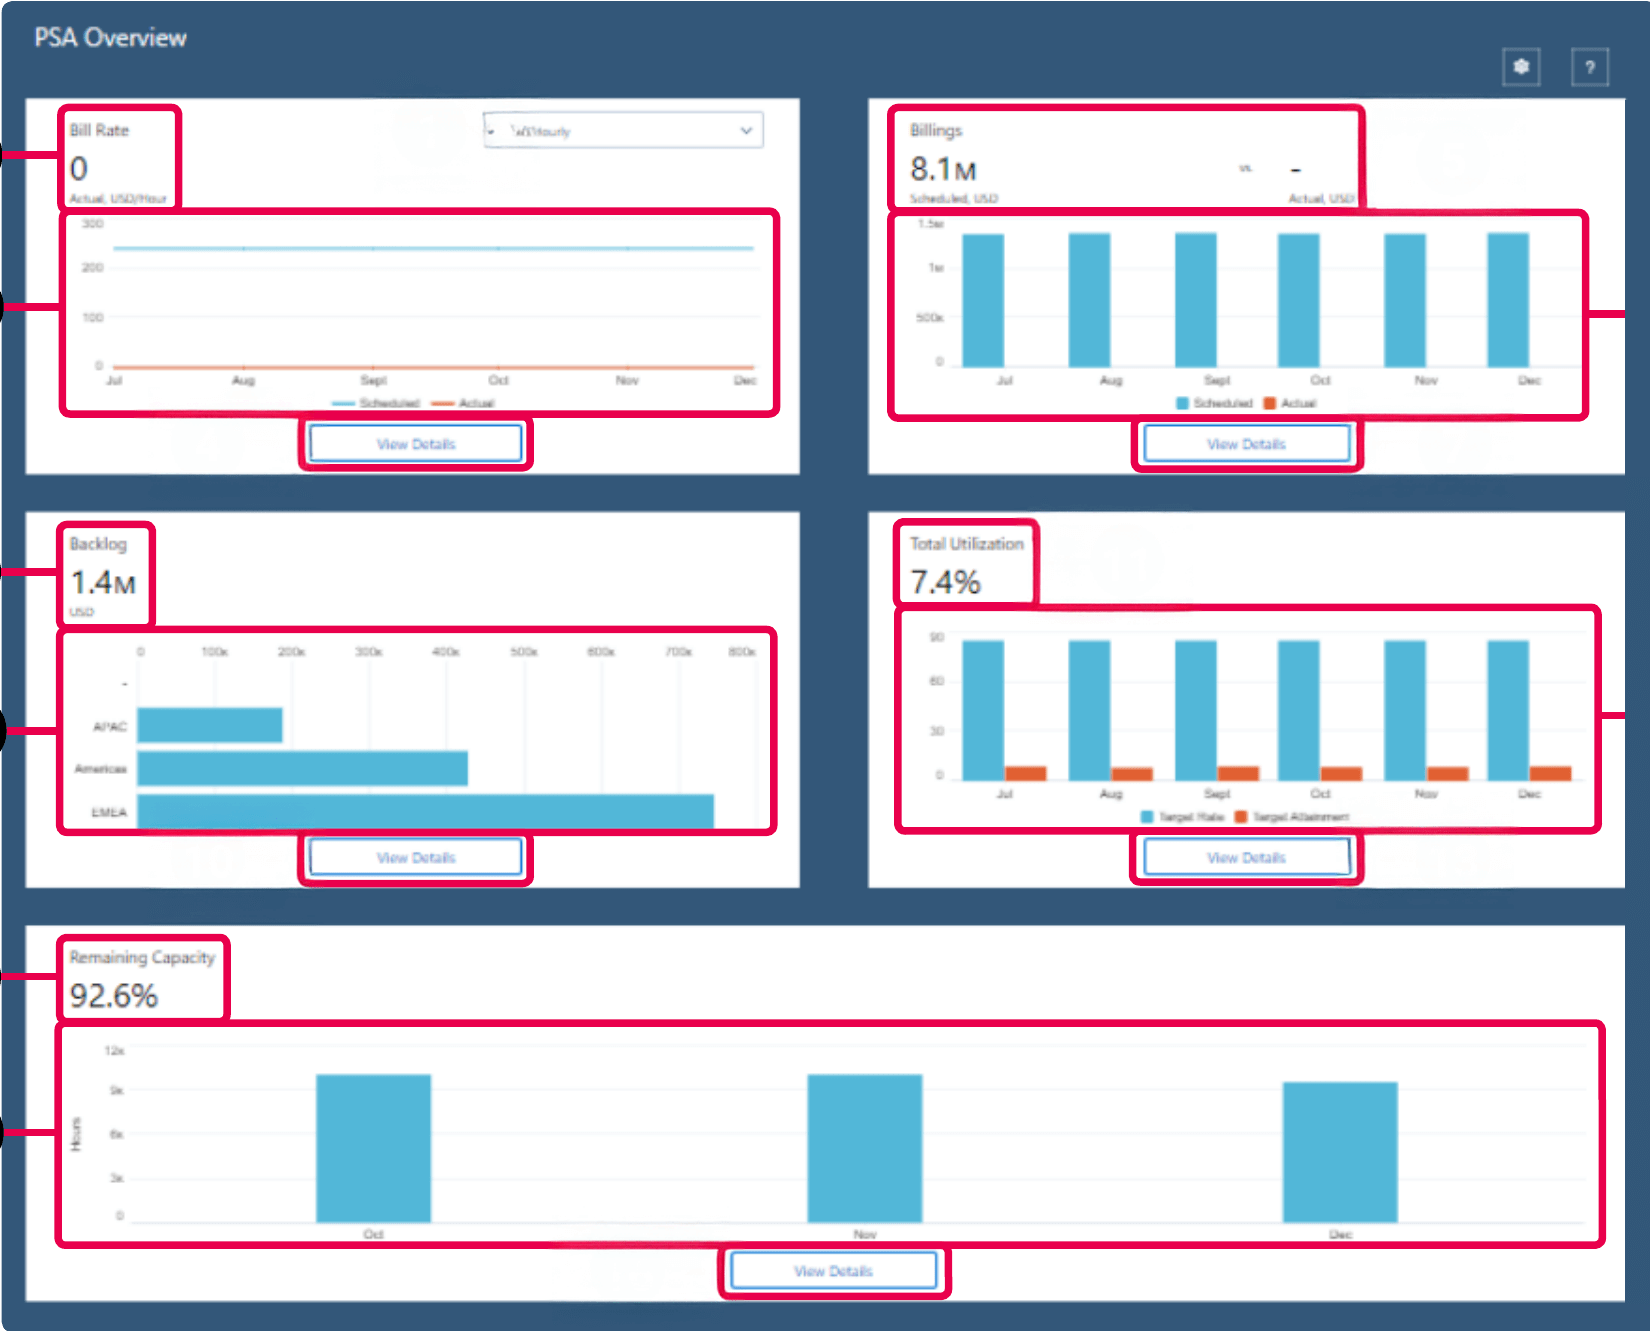
PSA Overview Dashboard
-
PSA Performance Summary Dashboard
This dashboard, part of the PS Cloud Advanced Analytics app, provides a summary of key KPIs along with visual graphs that make it easy to track and understand business trends. -
PSA Project Burnup Plus Dashboard
This dashboard applies predictive analytics to monitor project velocity trends and forecast burn-through dates, helping you identify when projects risk exceeding budgets or allocated hours.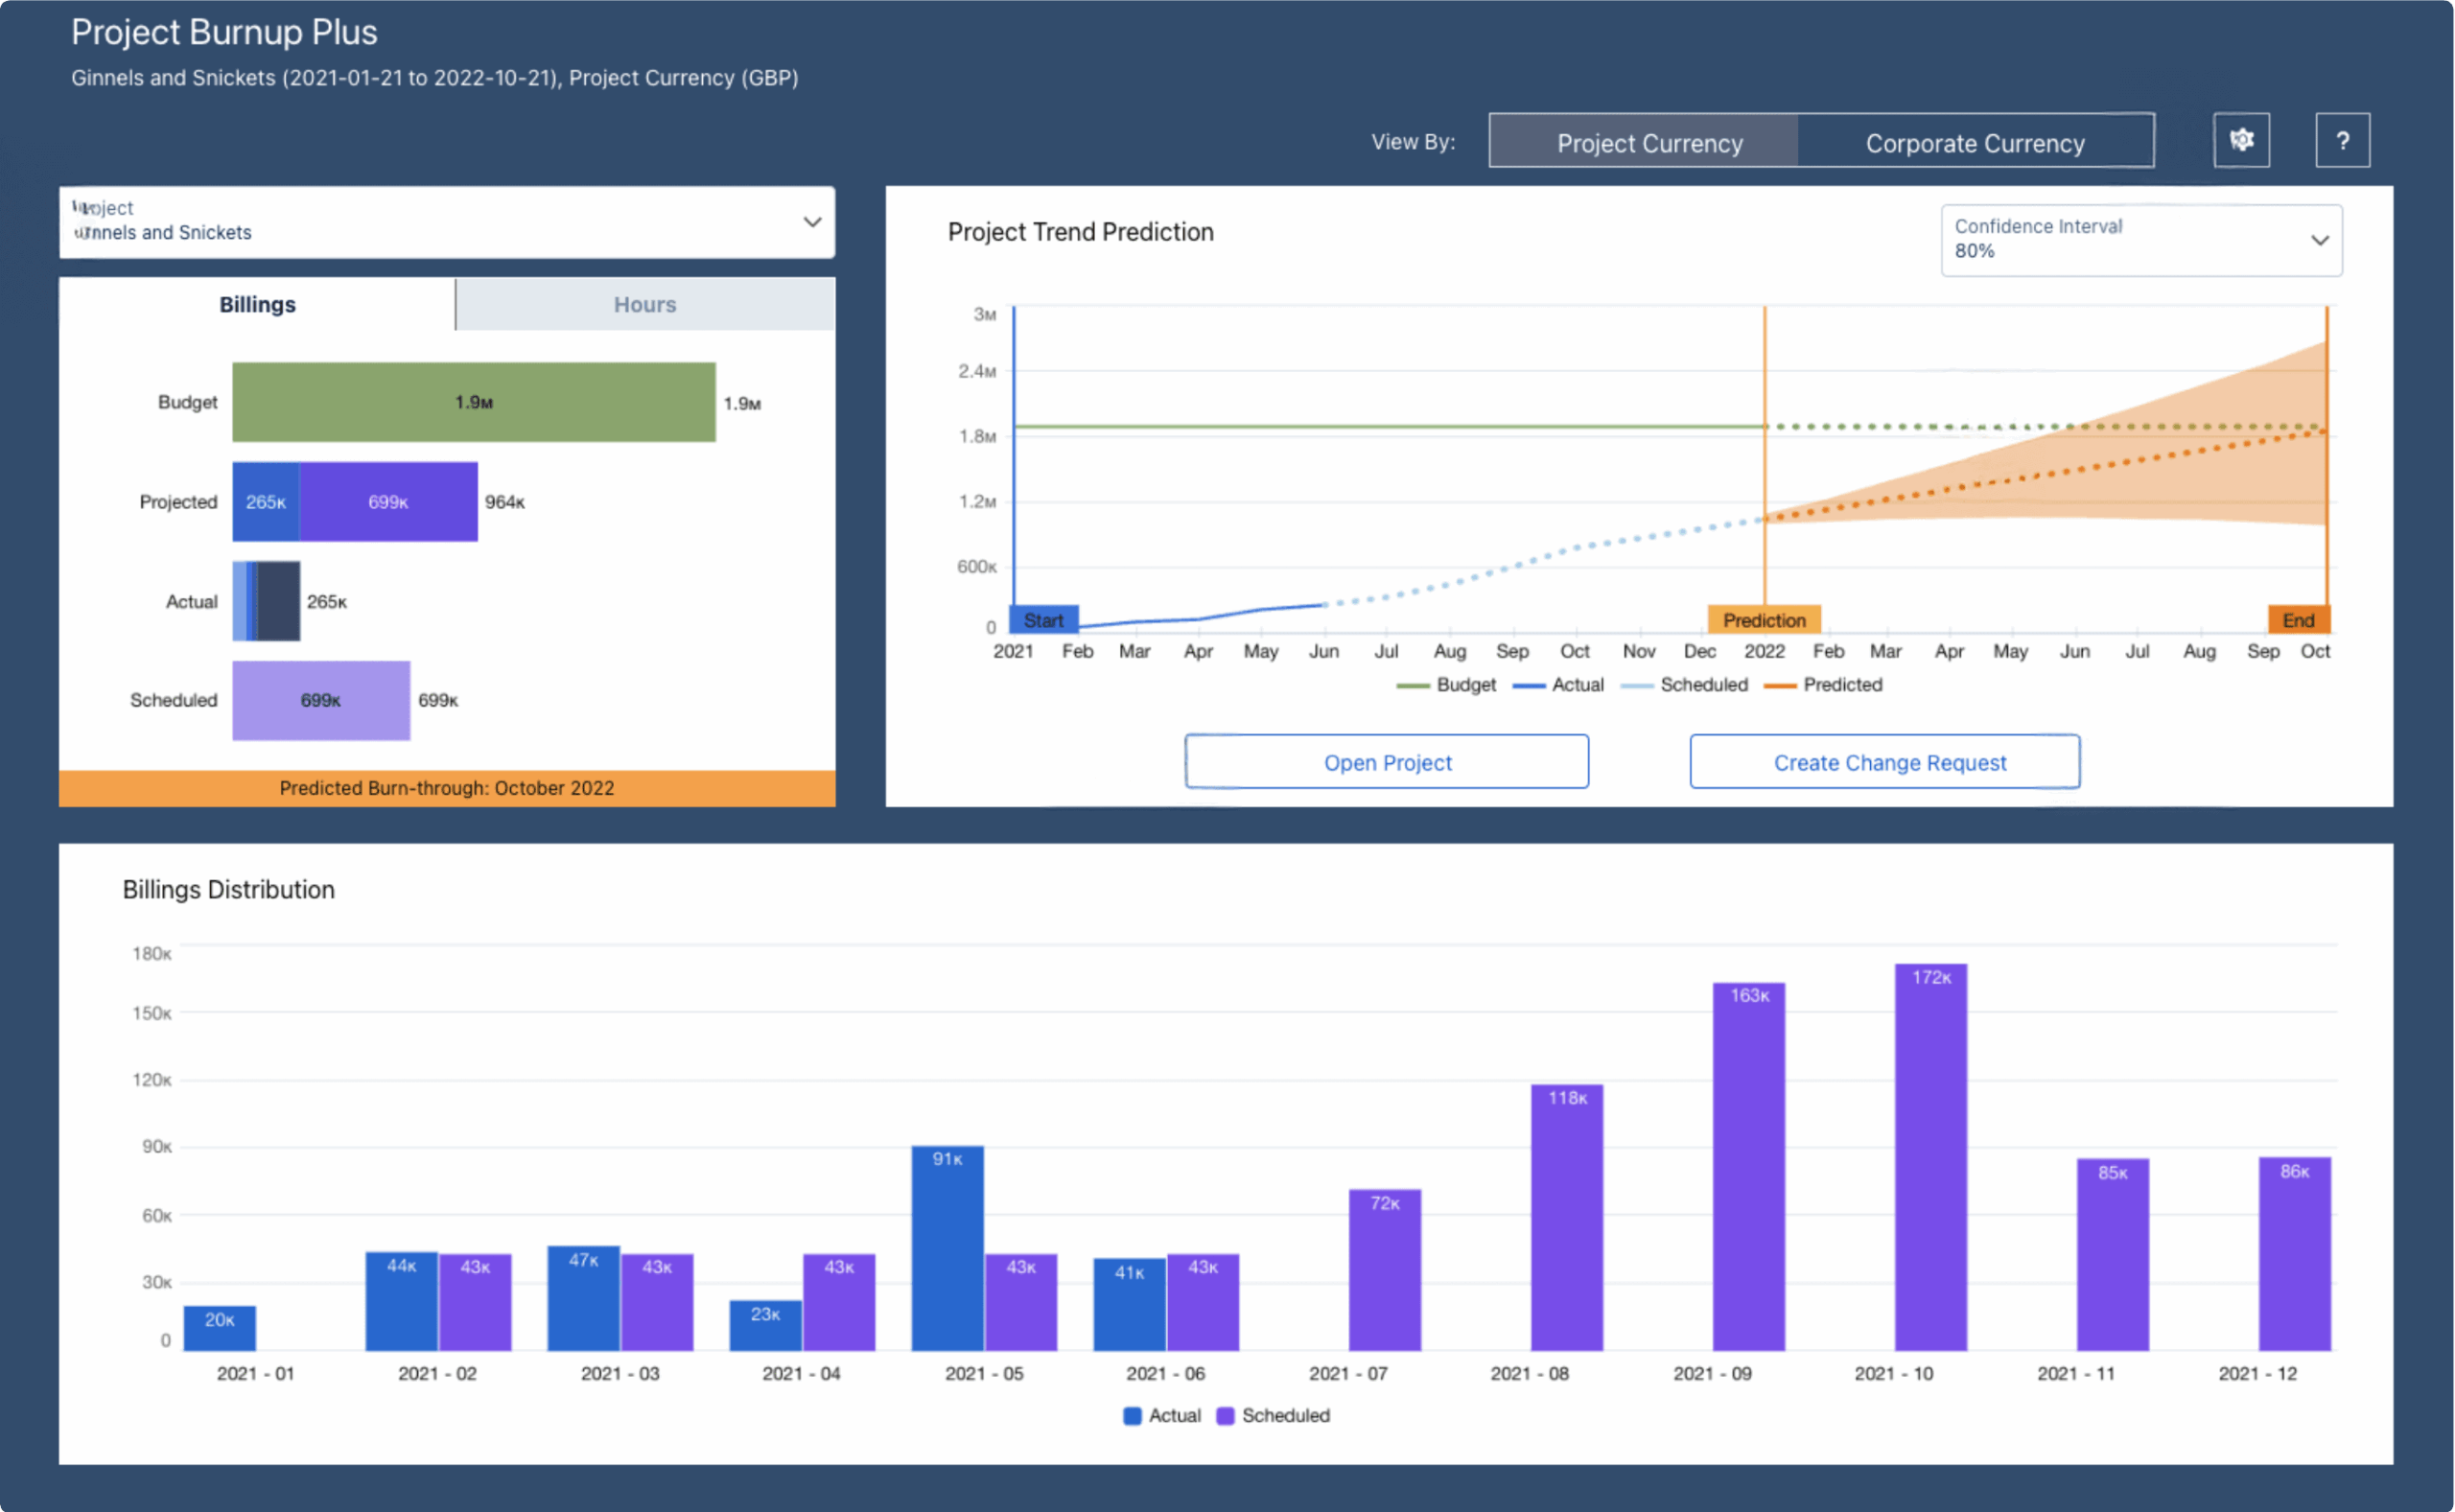
PSA Project Burnup Dashboard
-
Total Project Margin (Workspace) Dashboard
This dashboard leverages the Project Margin dataset and can be seamlessly integrated with the Project Manager workspace in PSA, giving managers direct access to financial performance insights. It consolidates project data into a single view, making it easier to track profitability across the portfolio. With this dashboard, you can visualize the total margin for all projects and apply predictive analytics to forecast expected margins. This enables proactive decision-making, helping teams protect profitability and address risks before they escalate. -
PSA Project Scheduling Risk Dashboard
This dashboard highlights projects that are at risk of falling behind or running ahead of schedule, giving you a clear view of potential delivery issues. By comparing scheduled versus actual hours, it shows how these variances have impacted revenue over the past 13 weeks. Looking ahead, the dashboard also forecasts schedule risks for the next 13 weeks by factoring in resource availability. This forward-looking view helps teams anticipate challenges and adjust plans proactively to keep projects on track. -
Viewing Project Details
The PSA Project Scheduling Risk Dashboard allows users to review project details with revenue insights and drill down to the resource or role level. It provides visibility into both past performance and upcoming schedules, helping teams stay informed and proactive. With this dashboard, you can view project details for the last 13 weeks or forecast for the next 13 weeks. It also provides detailed hours information by resource and role, ensuring better clarity for planning and risk management. -
PSA Revenue Forecast Summary Dashboard
The PSA Revenue Forecast Summary displays Revenue Forecast dataset and is available only in the PS Cloud Advanced Analytics app. -
PSA Skills Capacity and Demand Planning Dashboard
This dashboard brings together data from project reporting, utilization results, and resource skills to provide a clear view of available capacity by skill or certification. It helps align resource capabilities with project needs, ensuring the right expertise is available at the right time. Through this view, you can assess resource skills against project requirements, determine the number of resources needed to meet demand, and identify whether those needs can be met internally or externally. It also offers valuable investment insights to guide long-term talent development and workforce planning.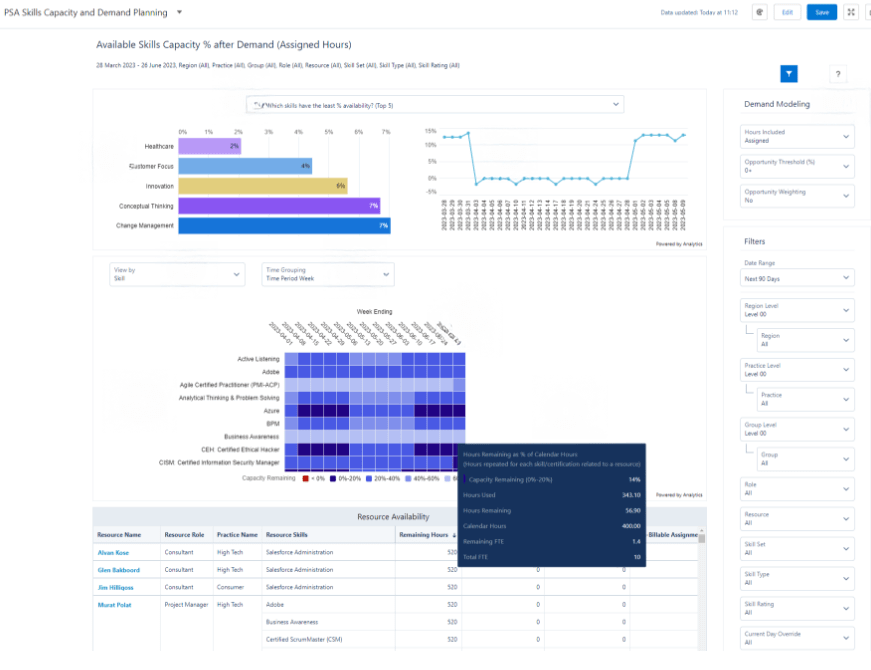
PSA Skills Capacity and Demand Planning Dashboard
-
PSA Utilization Analytics Capacity and Demand Planning Dashboard
Built as part of the PS Cloud Advanced Analytics app, this dashboard displays data from the Utilization Results dataset and is embedded directly into the PSA Resource Management workspace. It provides a unified view of resource demand and capacity, making it easier to align staffing with business needs. Users can drill down to see demand and capacity by role, region, practice, or group, and analyze breakdowns for specific date ranges and roles. The dashboard also offers detailed resource information from PSA, enabling smarter allocation and planning decisions. -
PSA Utilization Dashboard
This dashboard provides a clear view of the total resource utilization percentage KPI, giving teams an accurate measure of how effectively resources are being used. It also displays PSA scheduled hours alongside actual logged hours for easy comparison. By highlighting gaps between scheduled and actual utilization, the dashboard makes it simple to spot overallocated or underallocated resources, helping managers balance workloads and improve efficiency.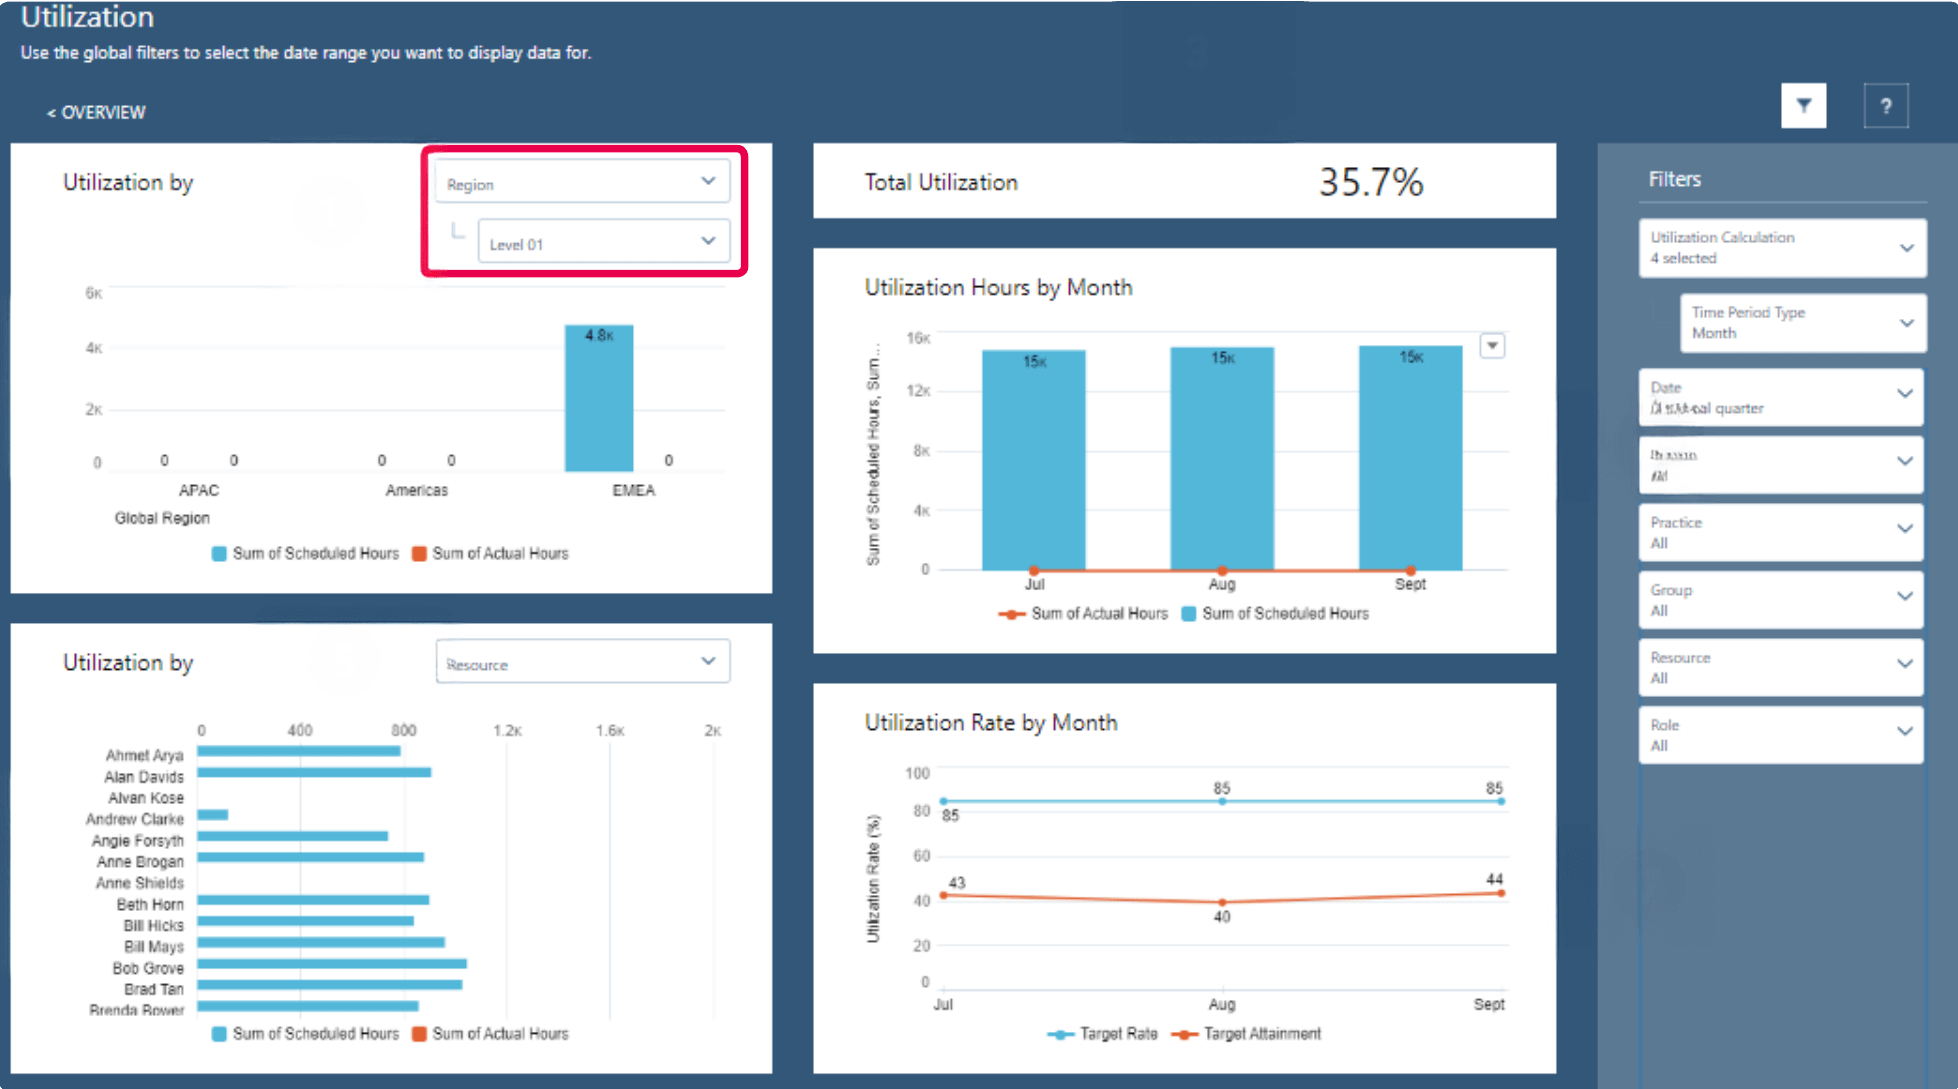
PSA Utilization Dashboard
-
PSA Utilization Summary Dashboard
The PSA Utilization Summary dashboard presents data from the current fiscal year, filtered by region, practice, and group. It gives managers a clear picture of how resources are being utilized across the organization. With this dashboard, users can track the total utilization percentage KPI, compare PSA scheduled hours with actual logged hours, and analyze utilization rates to quickly identify overallocated or underallocated resources.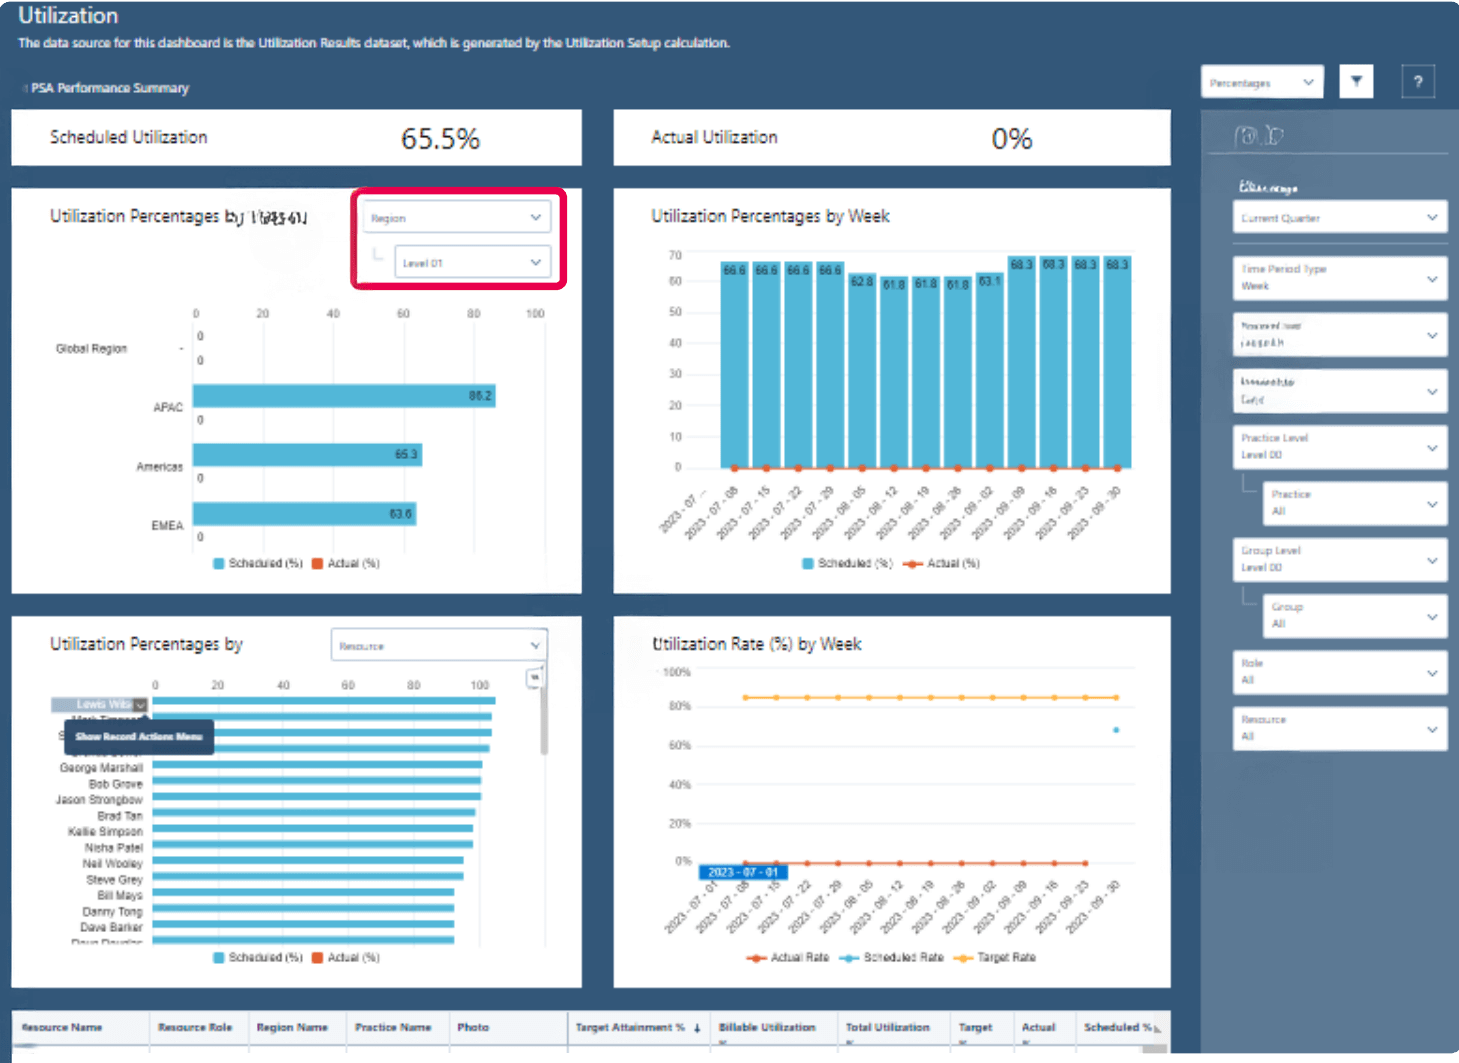
PSA Utilization Summary Dashboard
-
PSA Project Margin % Predictor (beta) Dashboard
This dashboard delivers insights into the predicted final margin percentage on projects using the Einstein Discovery Model. By analyzing historical data, it alerts project managers to potential risks in achieving planned margins and equips them with proactive guidance to address issues before they escalate. Drawing data from the Project Margin dataset in PS Cloud Core Analytics, the dashboard also provides actionable recommendations to mitigate risks and optimize margin performance, helping teams safeguard profitability and improve decision-making. -
PSA Staffing Risk Predictor (beta) Dashboard
This dashboard highlights the gap in days between the scheduled work start date of a resource request and the predicted staffing date. By exposing these delays, it provides visibility into potential revenue loss at the start of a project. With these insights, project managers can better predict and prioritize staffing needs, adjusting project plans as necessary to minimize delays and protect revenue.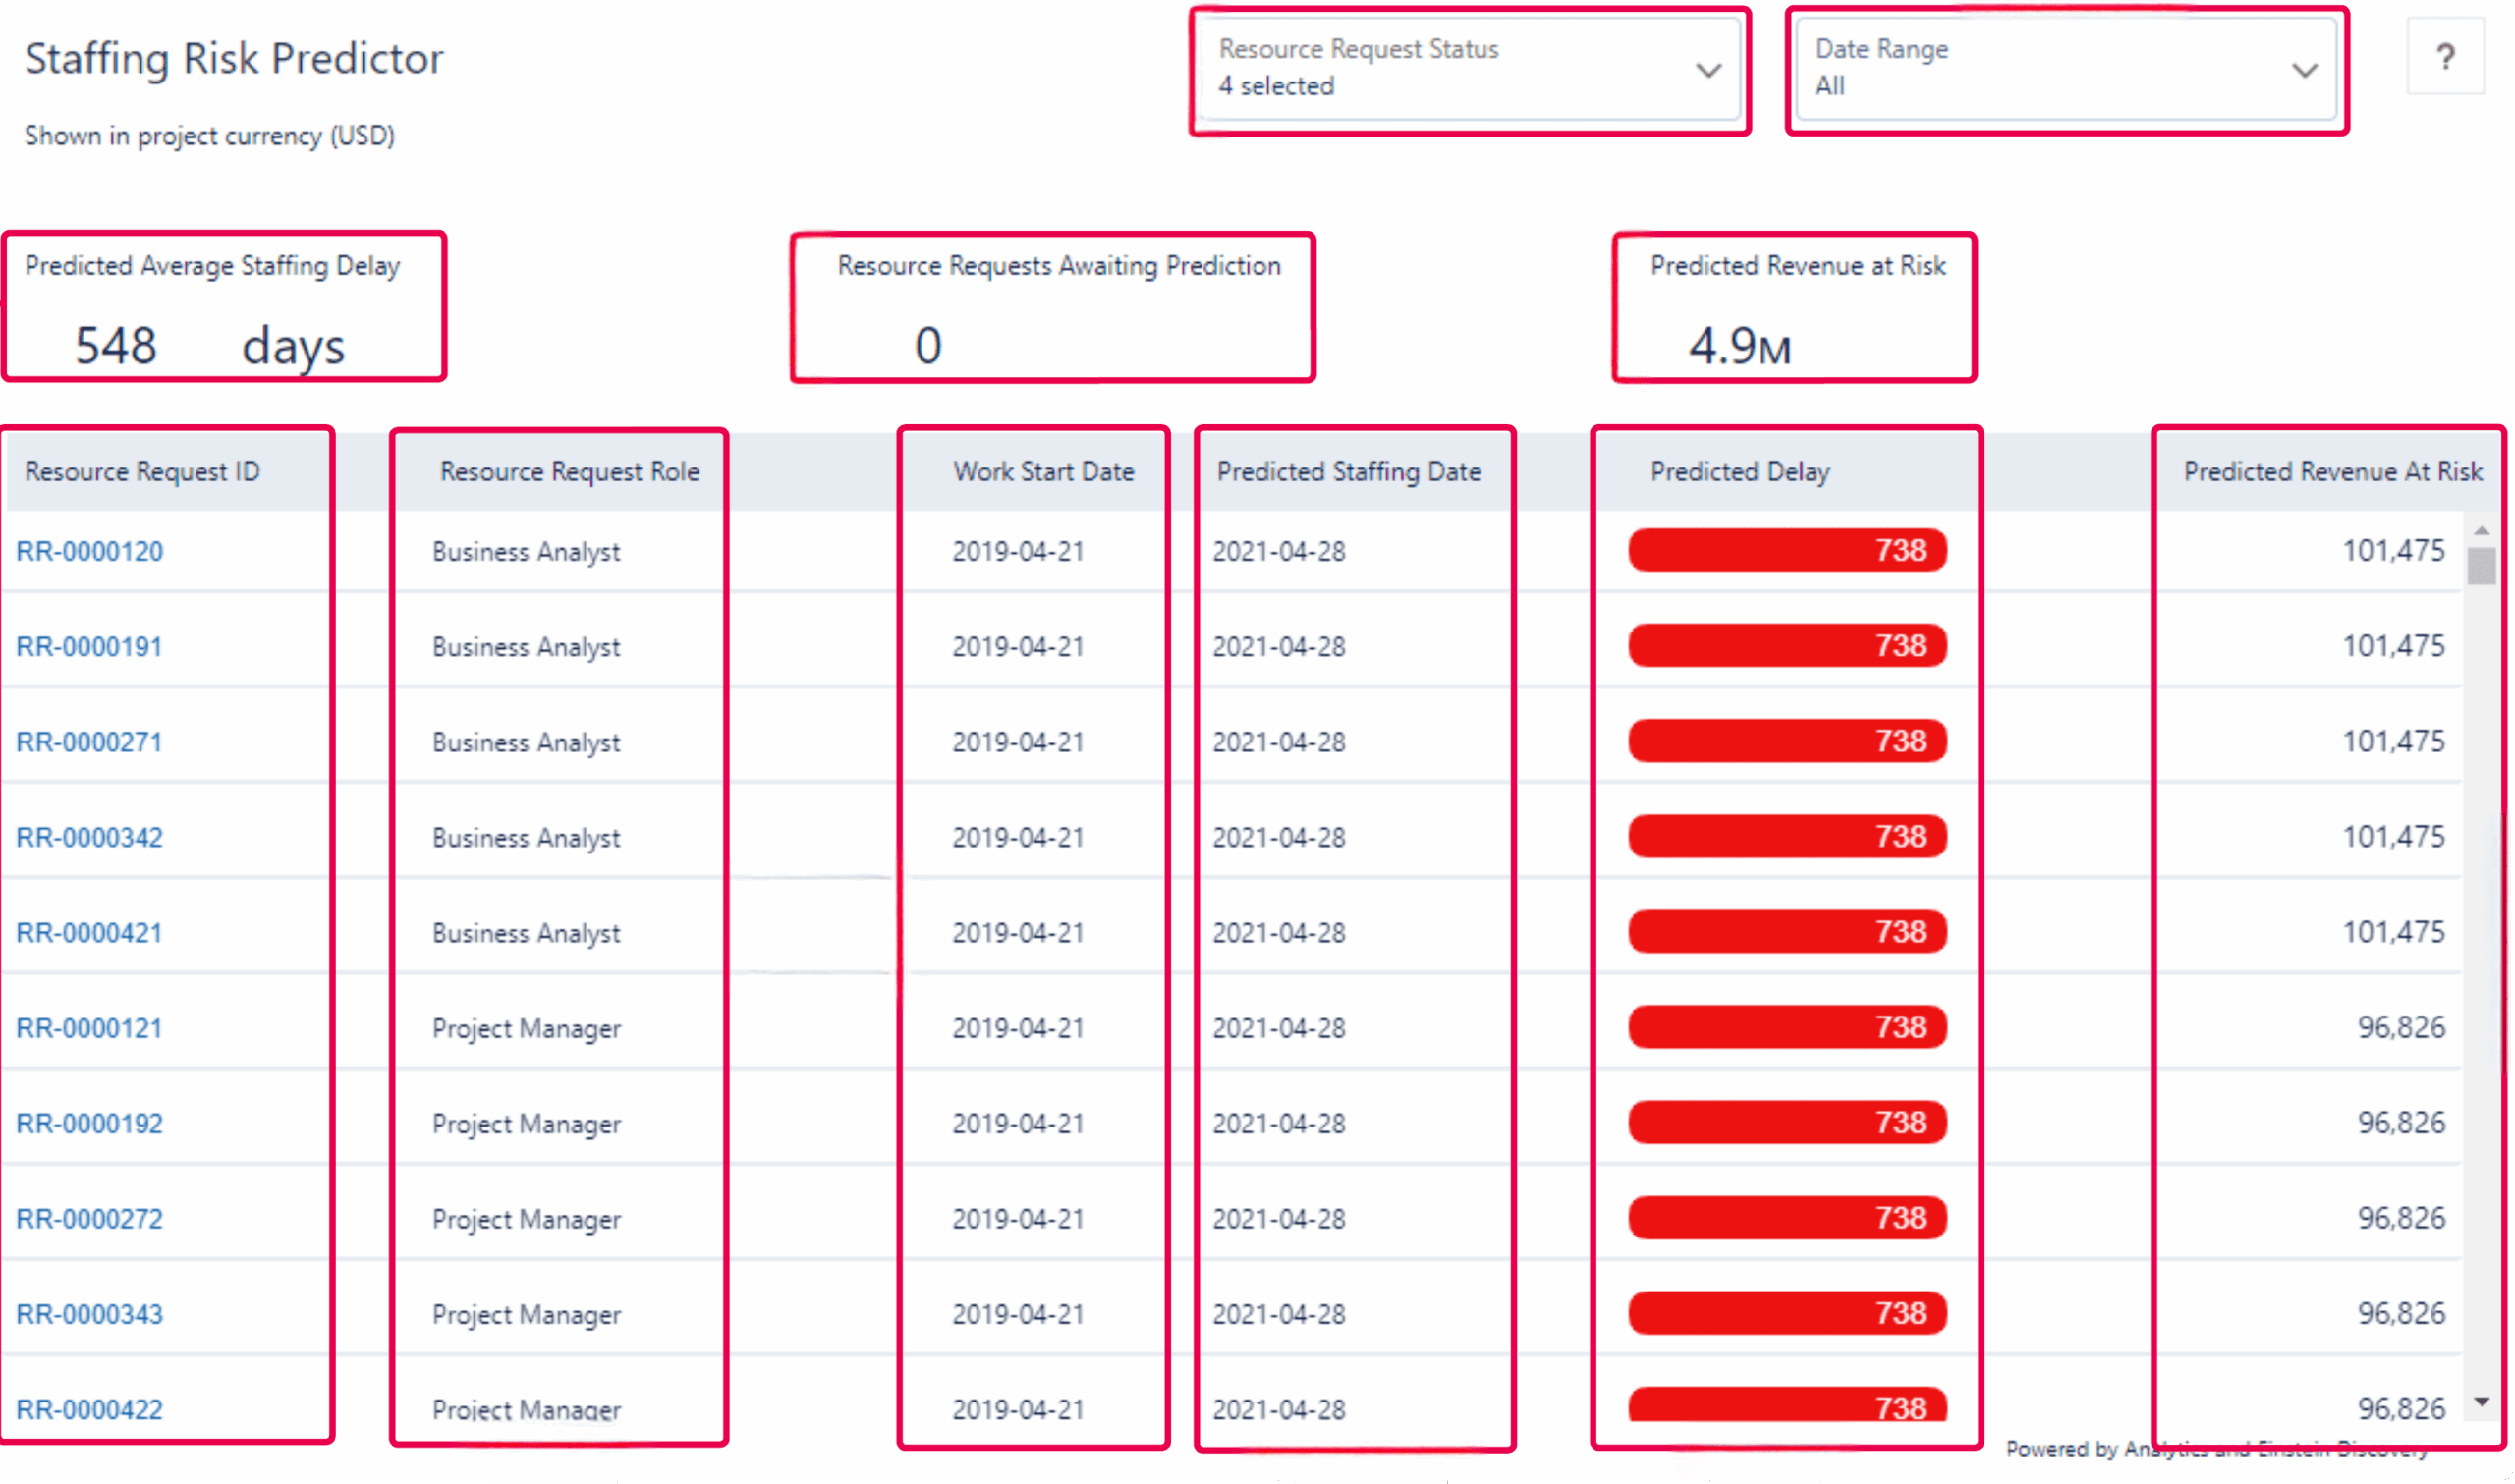
PSA Staffing Risk Predictor Dashboard
Author

AVP, AblyPro

Murali is the AVP – Certinia at AblyPro with 12+ years of experience in handling complex Certinia and Salesforce applications, implementations, configurations, and customizations. At AblyPro, he has been the pillar of all the Certinia PSA and ERP project deliverables, ranging from design to implementation, project management, and resource management. With years of practical knowledge and expertise in this industry, Murali supports the sales team in strategizing customer solutions to meet the actual business needs of the clients. Murali is a dynamic and experienced professional with multiple Certinia and Salesforce certifications, helping businesses to technically strive in this ever-changing landscape.