In part one of this blog, we walked you through the Financial management reporting application from FinancialForce. As mentioned in the previous blog, deploying these applications can be complex if you aren’t familiar with the fundamentals. So, to help you gain clarity, we’ve divided this series based on the three specific offerings from FinancialForce:
- Financial Management Reporting
- Financial Management Analytics, and
- PSA Analytics
Each segment begins by understanding the importance of each application. Then decodes a detailed overview of reports and dashboards to help you achieve the so-called state of nirvana in all your business operations.
Why are Reporting and Analytics Crucial for Your Business?
Replacing time-consuming spreadsheets with smart analytics does more than save manpower to create the same ole financial reports. Besides automating complex calculations with more accuracy and precision, FinancialForce dashboard features enable you to make better business decisions using real-time financial analysis, actionable analytics, and insightful modeling. Additionally, you get to combine data from all departments into a single wholesome dashboard.
This blog guides you through the Financial Management Analytics application using a step-by-step visual demonstration process to streamline your operations using its reports and dashboards.
Free eBook
12 Effective PSA Dashboards for Your Business

This eBook Will Cover
- Benefits of using PSA Dashboards for organizations.
- How Certinia PSA addresses the typical reporting challenges faced by boards.
- Step-by-step process to create a report in Certinia PSA.
- Learn about Certinia PSA Dashboards: Overview, Best Practices, and 12 PSA Dashboards.
Financial Management Analytics
Financial management (FM) analytics from FinancialForce has pre-packet KPIs, dashboards, and data lenses for financial analysis to run a more predictable, efficient business model and exceed customer expectations. FM has self-service analytics with drill-down and “slice and dice” capabilities to view revenue, margin, DSO, cash & EBITDA, and OOTD.
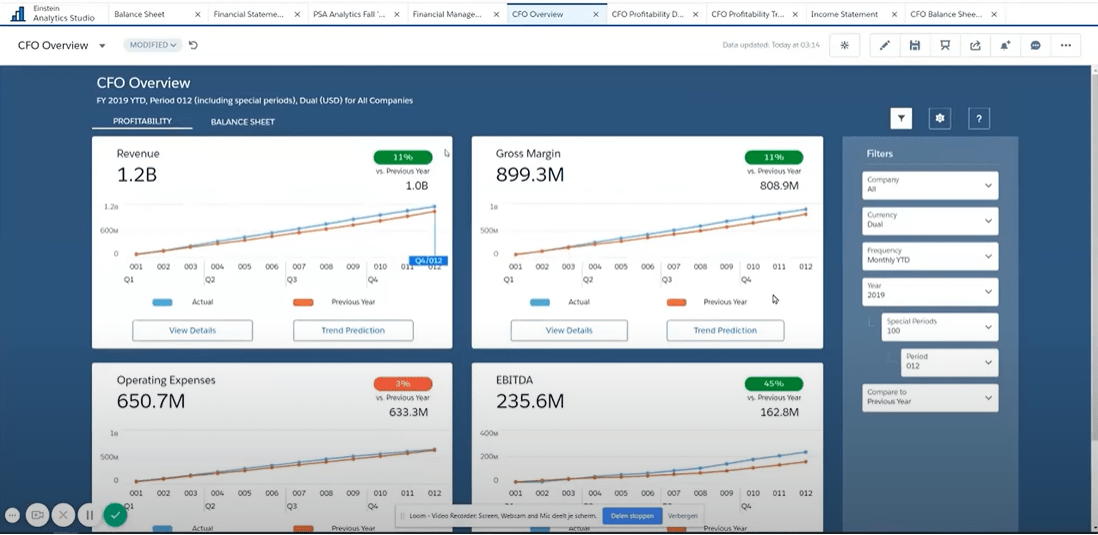
Get Complete Visibility
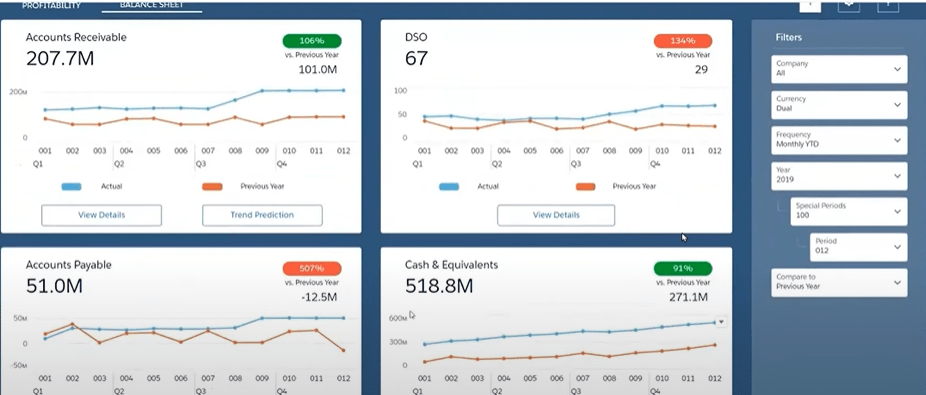
- Access this dashboard that tracks almost 8 KPIs divided over two tabs.
- The two tabs are namely Profitability and Balance Sheet.
- Get a single view across the entire customer experience – including actuals, expenses, assignments, milestones, resource requests, and backlog.
- Further, you can click on the view details of each KPI to break down the information.
Get a comprehensive breakdown of each KPI – see the example of Revenue
Revenue Trend
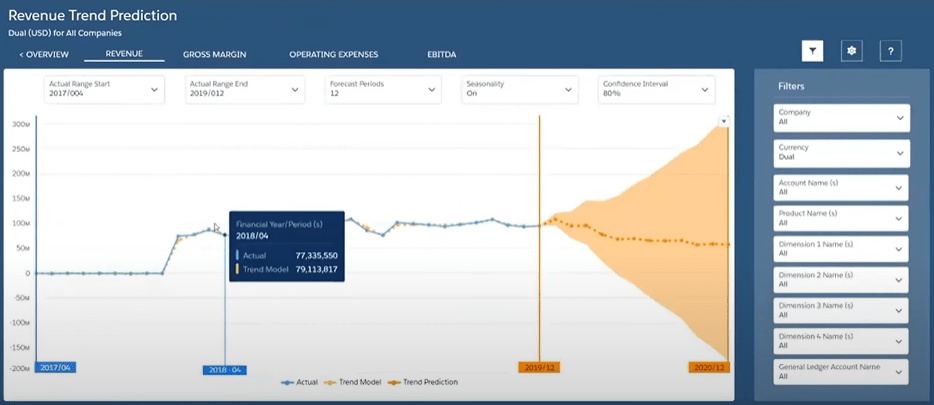
- The revenue trend enables you to view predictions and key metrics based on the historical data already present in the system.
- You can use filters to control the variants on display.
- The blue line represents your historical data of the actual revenue generated in the past years.
- Whereas the orange dotted line represents the revenue prediction for the coming year.
Also, get similar results for other KPIs by clicking on the view detail button. Check the example of the accounts receivable summary below:
Accounts Receivable Summary
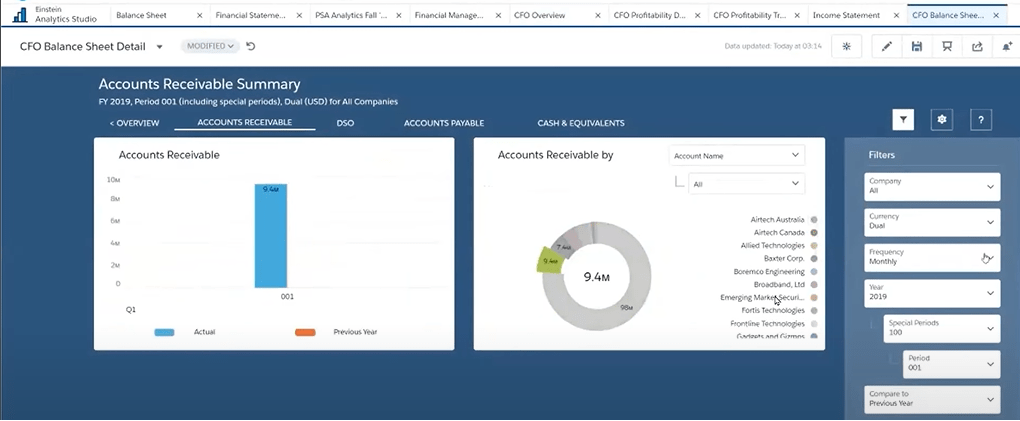
- The left view shows you the account receivable every quarter.
- On the right side, filter based on account names and their contribution to total revenue.
- Click on a section of the circular graph to get a drill-down view of a particular account.
Conclusion for Financial Management Analytics
FinancialForce reports and dashboards accelerate your business growth with unparalleled Insights. The Dashboards and fine-tuned data reports keep your operations running lean, consistent, and predictive. Get access to:
- Sales Visibility – Visibility into the sales pipeline helps information flow between sales and services.
- Faster Process – Get relevant reporting and analytics at your fingertips so that you can make critical business decisions anytime, anywhere.
- 360 degree – Obtain a real-time understanding of customer lifetime value with actionable comprehensive insights.
- KPIs – Access dashboards to visualize key performance indicators (KPIs) and trends in your business.
- Predictability – Utilize intelligent data to predict future revenues, collections, cash flow, and other business outcomes.
Want more materials to get a deeper understanding of FinancialForce reports and dashboards? Access AblyPro’s on-demand webinar here.
If you need a FinancialForce expert to discuss your business requirements and solve your queries, feel free to call us at 240-259-3076 or write to us at wecare@ablypro.com to schedule a meeting.