In this blog, we’ll conclude this three-part blog series by decoding the complexity of FinancialForce reports and dashboards on PSA Analytics. Further below, you’ll discover a detailed overview of PSA analytics that will help you achieve the state of nirvana in all your business operations.
In the previous parts of this blog, we explored the two offerings from FinancialForce; Financial Management Reporting and Financial Management Analytics.
Why are Reporting and PSA Analytics Crucial for Your Business?
We use analytics to replace time-consuming financial report spreadsheets. However, besides automating complex calculations with more accuracy and precision, FinancialForce dashboard features have lots more to offer. It enables you to make better business decisions using real-time financial analysis, actionable analytics, and insightful modeling. The best part, you get to combine data from all departments into a single wholesome dashboard.
Let’s now dive straight into exploring the main components of PSA analytics.
Professional Service Automation (PSA) Analytics
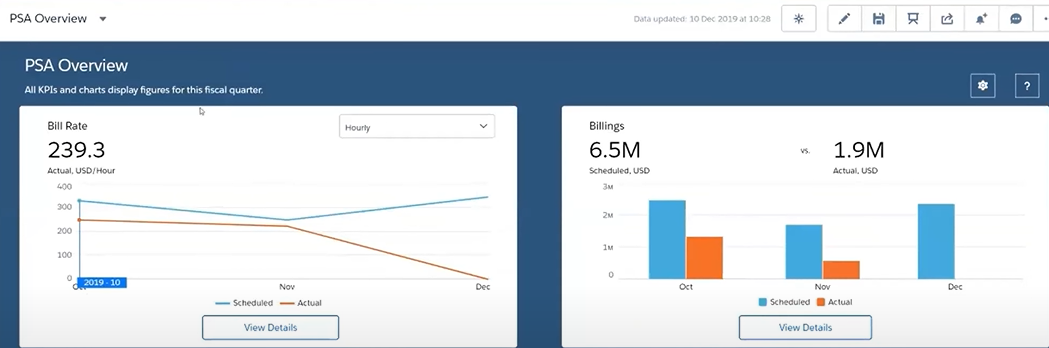
PSA analytics enables service organizations to maximize financial reporting using actionable real-time insights and improved business agility. You can leverage the pre-built KPIs and metrics available on your PSA to get complete visibility into Billings, Backlog, Utilization, and Capacity Analysis OOTB.
Below is a visual representation of the six major KPIs on your PSA dashboard: Bill rate, Billings, Backlog, Total Utilization, Forecast, and Remaining Capacity.
Billings
Click on VIEW DETAILS to view a detailed breakdown of the billings KPI.
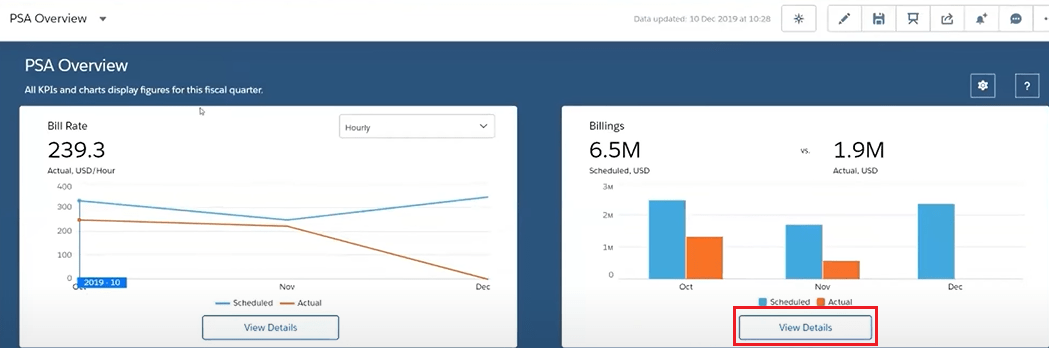
Use the Filters to control what you want to view.
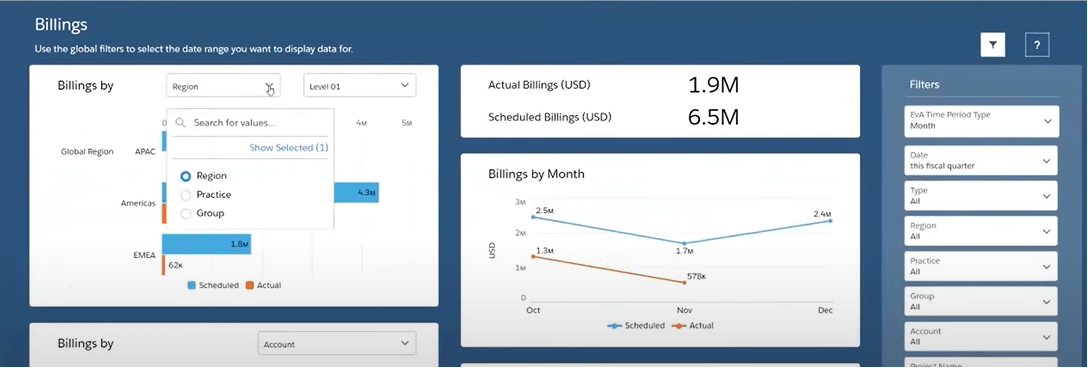
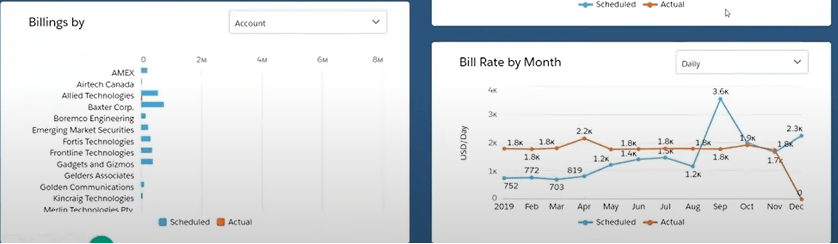
You can analyze data on FinancialForce PSA dashboards using different dimensions such as account, region, month, and rate.
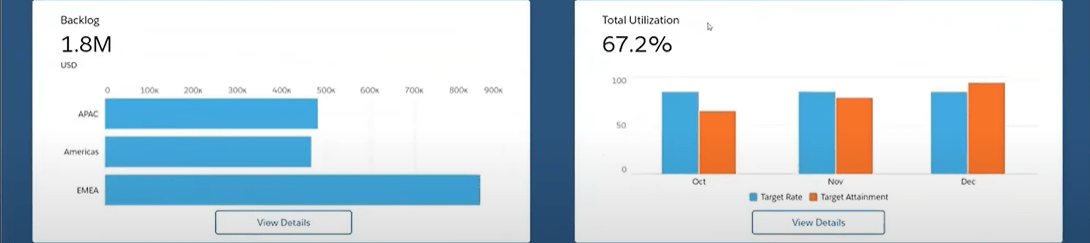
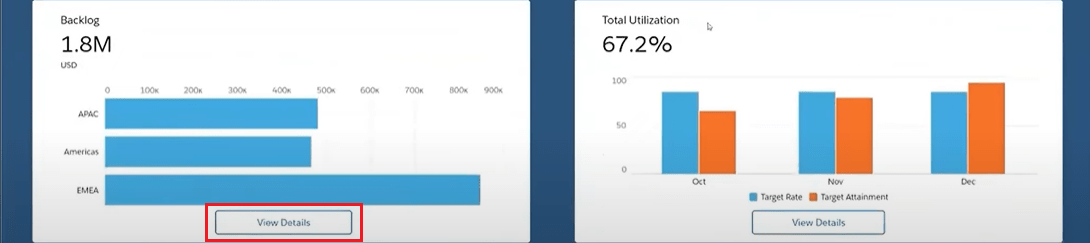
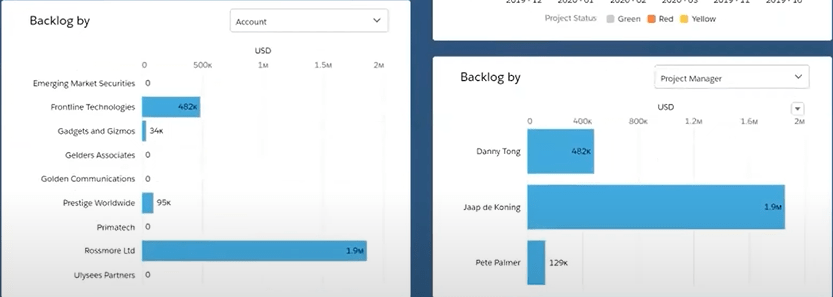
Backlog
Click on VIEW DETAILS to view a detailed breakdown of the Backlog.
On the left, you can see backlogs by regions and the right side of the image shows your backlogs by month.
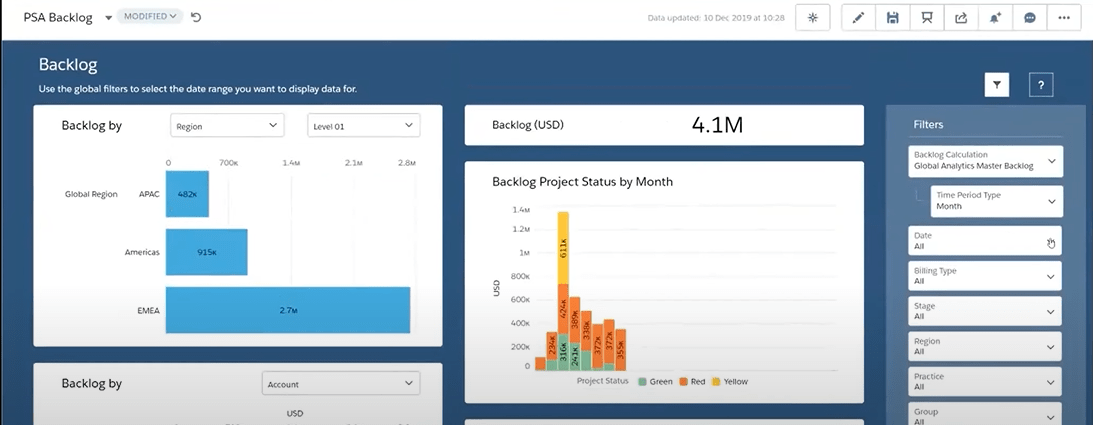
You can break down Backlogs based on dimensions like time, region, and account holders.
Utilization
Switch to utilization to view PSA from a utilization standpoint
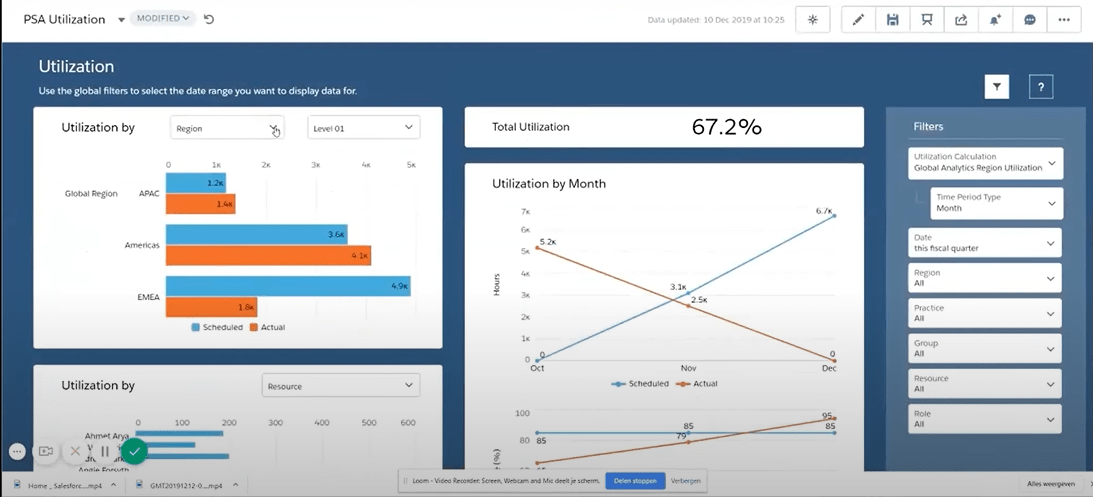
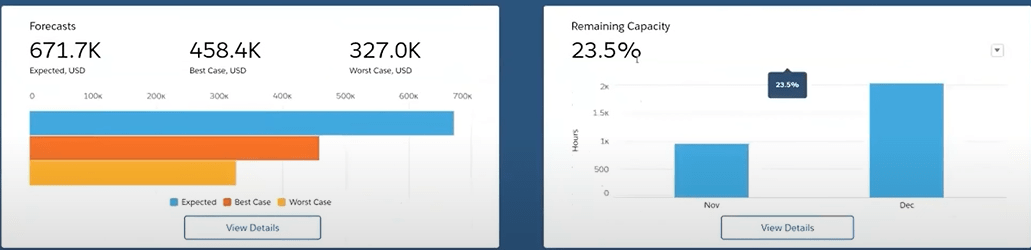
Locate the most utilized group of people on this tab.
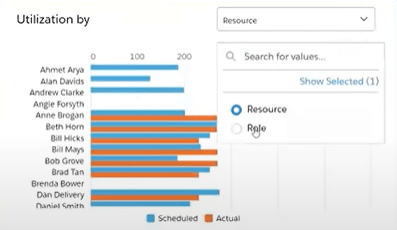
Use this feature to understand the resources you ought to hire as per the skills you currently need.
Conclusion For PSA Analytics and its Main Components
FinancialForce reports and dashboards accelerate your business growth with unparalleled Insights. The Dashboards and fine-tuned data reports keep your operations running lean, consistent, and predictive. Get access to:
- Sales Visibility – Visibility into the sales pipeline helps information flow between sales and services.
- Faster Process – Get relevant reporting and analytics at your fingertips so that you can make critical business decisions anytime, anywhere.
- 360 degree – Obtain a real-time understanding of customer lifetime value with actionable comprehensive insights.
- KPIs – Access dashboards to visualize key performance indicators (KPIs) and trends in your business.
- Predictability – Utilize intelligent data to predict future revenues, collections, cash flow, and other business outcomes.
Want more materials to get a deeper understanding of FinancialForce reports and dashboards? Access AblyPro’s on-demand webinar here.
If you need a FinancialForce expert to discuss your business requirements and solve your queries, feel free to call us at 240-259-3076 or write to us at wecare@ablypro.com to schedule a meeting.