In today’s fast-paced business landscape, providing exceptional customer service is not just an aspiration but a necessity for success. Every interaction with your customers is a golden opportunity to build lasting relationships, foster loyalty, and elevate your brand to unprecedented heights. Yet, how can you operate at your best in the face of an ever-changing digital world and massive client data?
That’s where Salesforce Service Cloud Dashboards & Reports come to the rescue, leading you to the path to customer-centric success. These dynamic tools are not merely a collection of charts and graphs; they are gateways to understanding customer behaviors, identifying service bottlenecks, and making data-driven decisions that resonate with your audience.
So, let’s navigate the realm of Salesforce Service Cloud Dashboards & Reports and understand how it can help service businesses!
Why the Need for Service Cloud Dashboards and Reports for Enterprises?
Salesforce Service Cloud offers a myriad of benefits & features that combine to make it one of the most complete customer service platforms, with the most lucrative solutions. Let’s look at some common pain points faced by customers & agents.
First Pain Point: The Rising Trend of Self-Service
Most of the users don’t need the attention of customer support, which may be focused on more complicated issues.
How Service Cloud Dashboards & Reports solves them?
Instead of calling customer care, consumers can utilize the Salesforce Service Cloud capabilities of self-service portals to obtain solutions to their questions. Retailers may create branded self-service sites with all potential inquiries & even use AI with Salesforce Einstein to improve the entire customer experience.
Second Pain Point: Siloed Customer Service
Service agents rarely have a comprehensive perspective of a user and must rely on numerous systems to obtain a unified case history. So, the required resolution is not provided, resulting in longer wait times and lower customer satisfaction scores.
How do Salesforce Service Cloud Dashboards & Reports help this issue?
Reps can track user information on a single dashboard and interact via their preferred channel with the Salesforce Service Cloud case management solution. Agents can redirect customer comments posted on a company’s social media website to the support team and even automate user feedback.
Top 5 Benefits of Salesforce Service Cloud Dashboards & Reports
Salesforce Service Cloud Reports & Dashboards increased both the efficiency of customer service reps and the brand’s overall customer experience. Let’s delve in it deeper.
- Streamlined Case Management: Case routing automation enables support staff to resolve problems quickly without manually registering them. You may delegate jobs to agents who have the necessary qualifications and expertise, and you can manage the duties among the agents.
- Improved Customer Satisfaction: The Service Cloud dashboards bring you a social customer service feature that provides customer service teams with the resources they need to handle consumer inquiries on Instagram, Facebook, Twitter, and other social media channels and routes them to the right agents. It also provides your team with a 360-degree perspective of your customer, which helps in real-time social media interaction on platforms where your customers are engaged.
- Data-Driven Decision Making: By leveraging real-time reports in the Salesforce Service Cloud, business executives can examine a customer’s entire case history & make informed decisions. The dashboard gives experts a 360-degree perspective, allowing them to conveniently manage client information & problems and deliver answers quickly & efficiently.
- Agent Performance Optimization: Salesforce Service Cloud reports & dashboards assist enterprises in enhancing customer care agent progress and performance. This is made possible by the ‘Omni-Channel Presence and Routing’ feature of Service Cloud. It enables reps to access all necessary information about customers & then provide customized solutions, incentives, and special offers based on their purchasing habits.
- Data Transparency and Accountability: Service Cloud reports & dashboards allow you to integrate customer data across many devices & channels to ensure data transparency. You get a consolidated picture of all customer interactions, including emails, chats, social media mentions, and phone conversations.
Top 5 Salesforce Service Cloud Dashboards for Enterprises
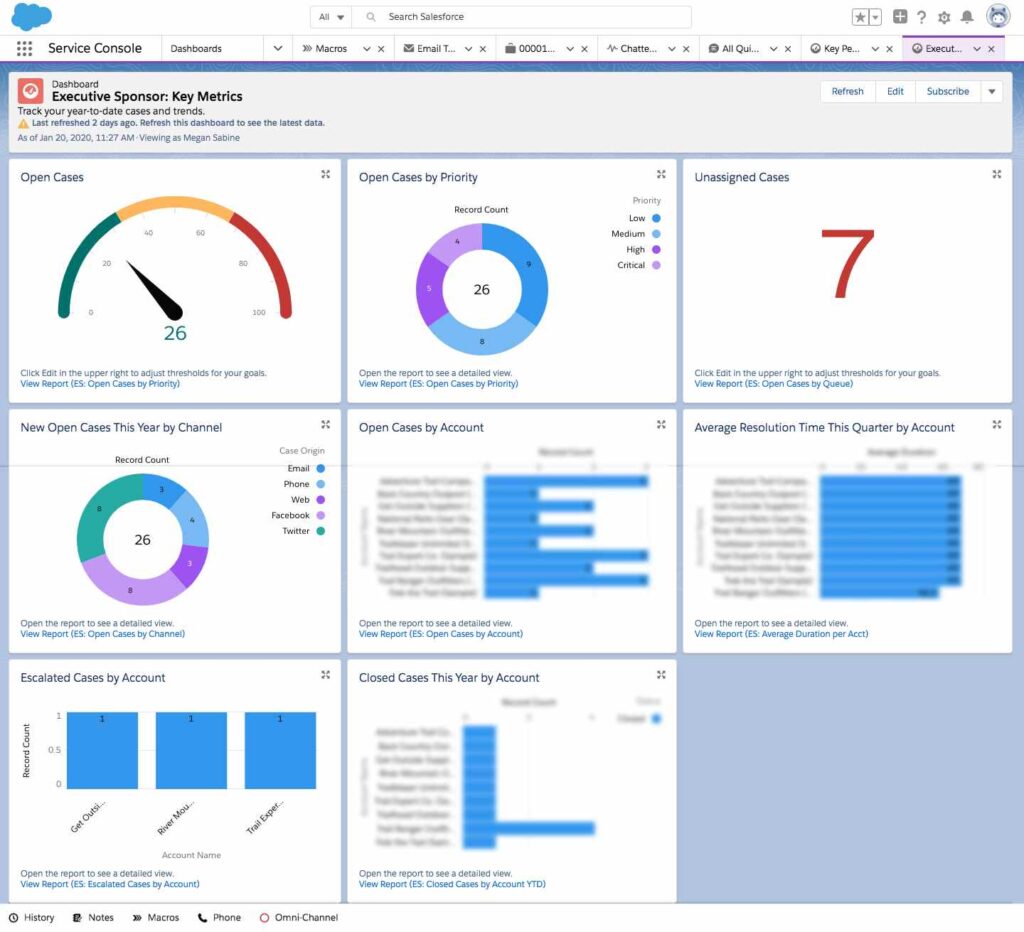
1. Executive Sponsor: Key Metrics Dashboard
This Key Metrics Dashboard is intended for executives & managers, providing high-level visibility into the general scenario around customer service situations and may be used as a corporate health check. It may include revenue metrics, customer satisfaction scores, profitability, market share, and other critical data points. This dashboard displays:
- Case priority
- Open case counts
- Unassigned case counts
- Average resolution timeframes
With this real-time insight, executive sponsors can make data-driven decisions, identify areas of improvement, and set strategic goals for the organization’s growth.
Source: https://appexchange.salesforce.com/
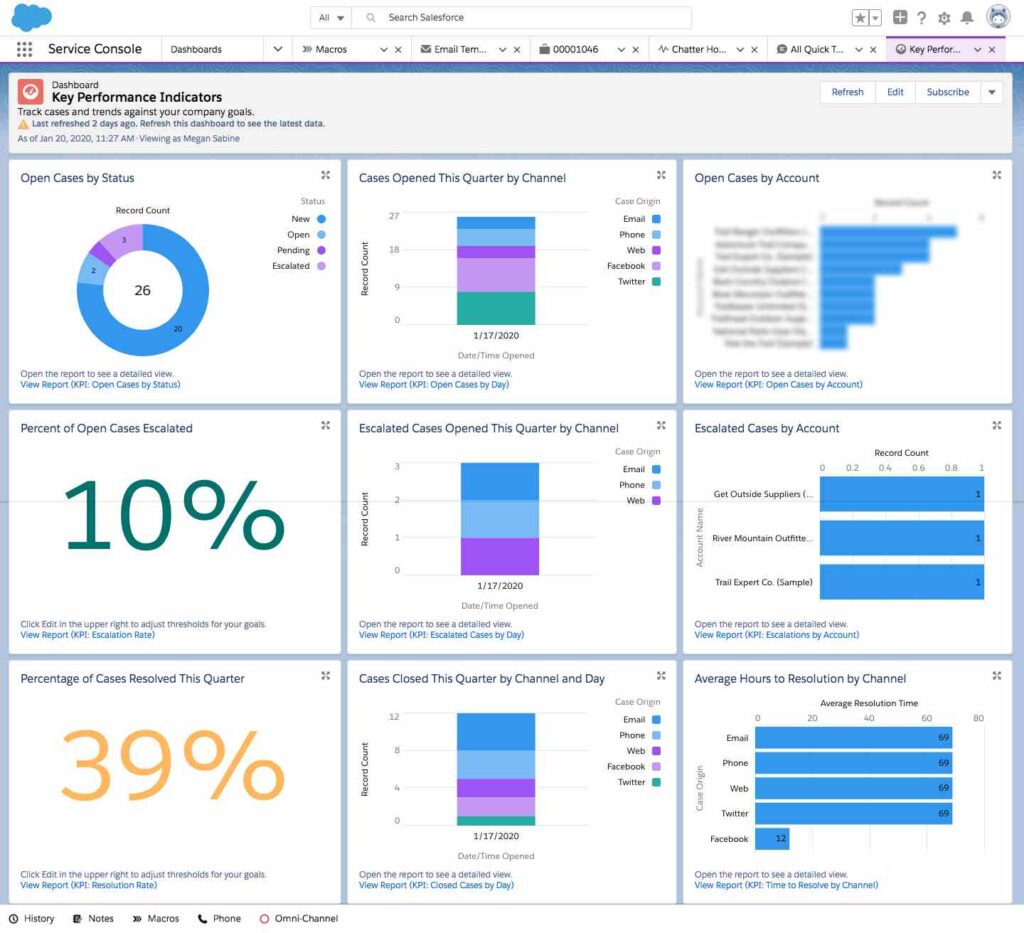
2. Key Performance Indicators Dashboard
The Key Performance Indicators Dashboard is designed to cater to various stakeholders across the organization, enabling them to track specific metrics related to their roles & responsibilities. This dashboard focuses on the key KPIs that every customer support staff should be aware of. Indicators on the dashboard mainly include:
- Website traffic
- Conversion rates
- Open cases by status
- Social media engagement
- Escalated case percentages
- Average resolution times by channel
Source: https://appexchange.salesforce.com/
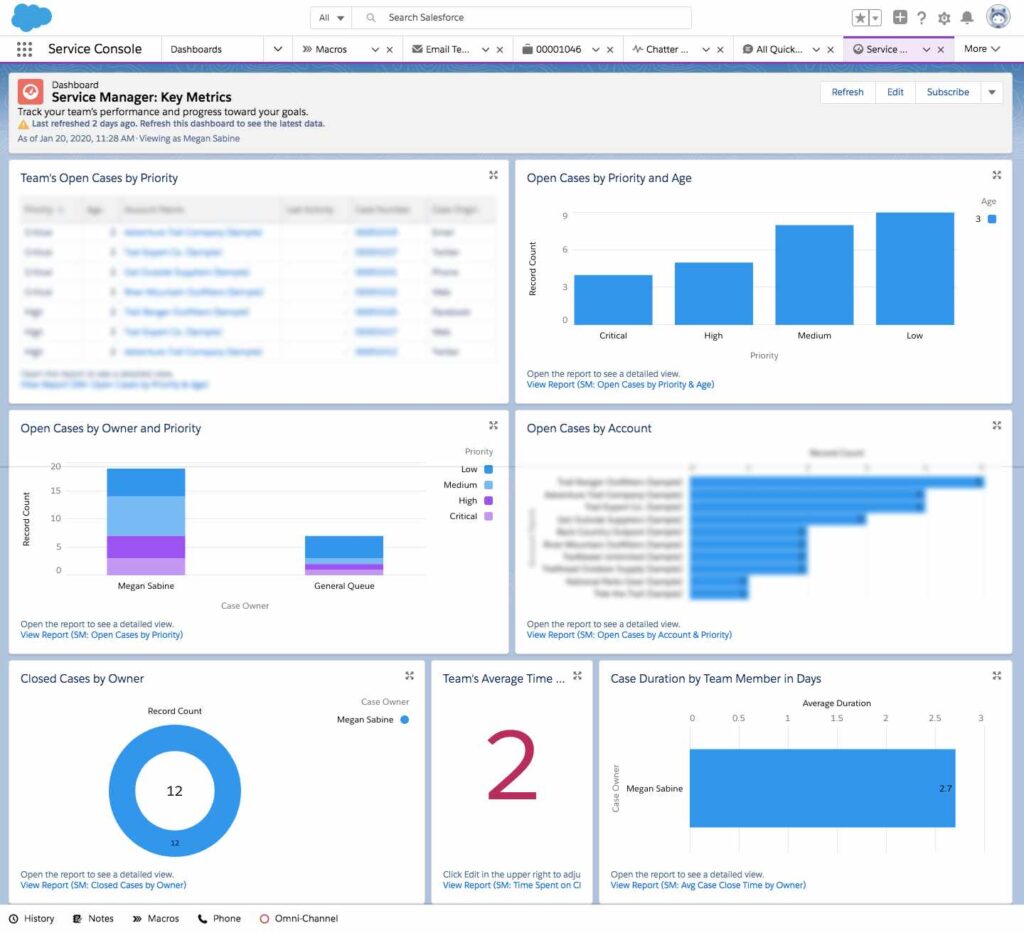
3. Services Managers: Key Metrics Dashboard
This particular dashboard has somewhat similar analytics as the executive sponsor & key performance indicators dashboards, but it is mainly focused on their team. For instance, service managers benefit from a tailored Key Metrics Dashboard that provides insights into the performance of their service departments. It typically displays metrics related to:
- Customer support and satisfaction
- Service ticket volume
- Response times
- Resolution rates
- Agent performance
With this data at their fingertips, service managers can efficiently allocate resources, optimize workflows, and identify opportunities for service improvement. It empowers them to enhance the overall customer experience, ensuring that the organization meets its service level commitments.
Source: https://appexchange.salesforce.com/
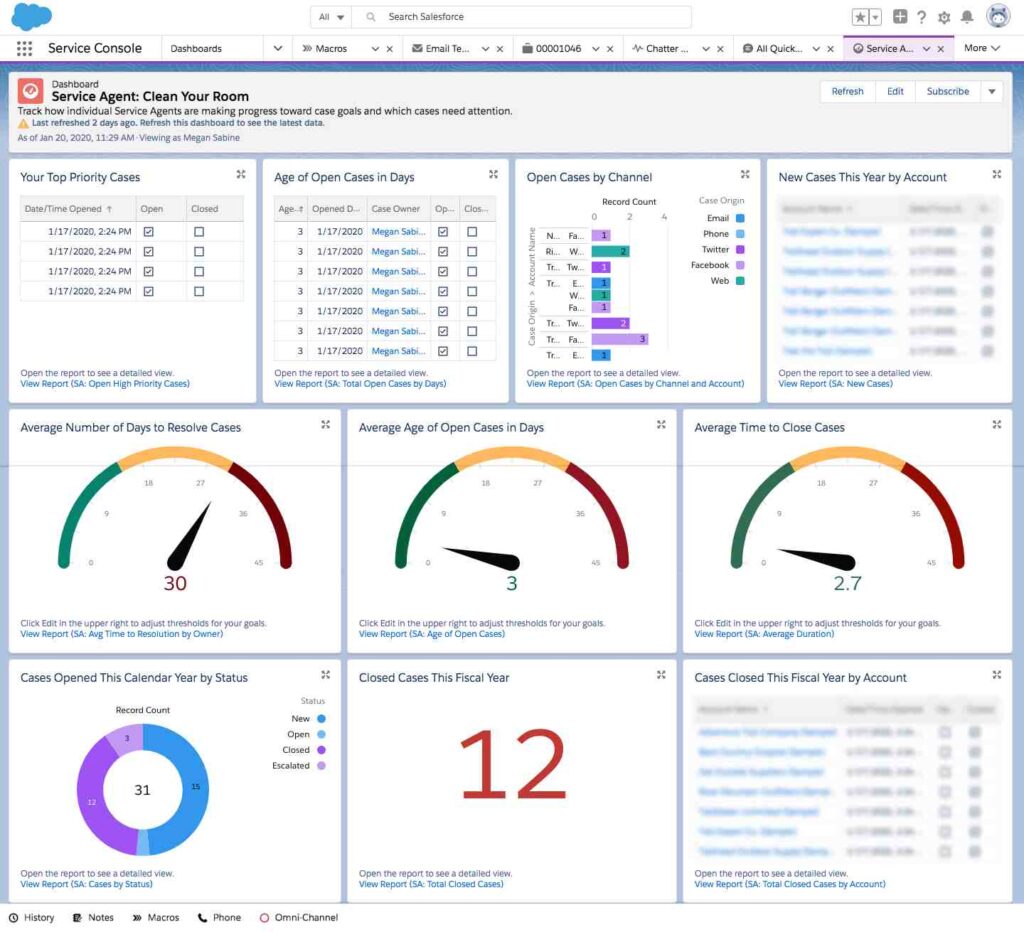
4. Service Agent: Clean Your Room Dashboard
This dashboard is intended for front-line agents, those who own and actively work cases. This dashboard is intended to assist them in keeping track of their performance indicators to ensure that nothing falls through the cracks. Agents can track parameters such as:
- Top Priority Cases
- Age of Open Cases in Days
- Open Cases by Channel
- Average Number of Days to Resolve Cases
- Average Time to Close Cases
- Cases Closed this Fiscal Year by Account
- Cases Opened this Fiscal Year by Status
Source: https://appexchange.salesforce.com/
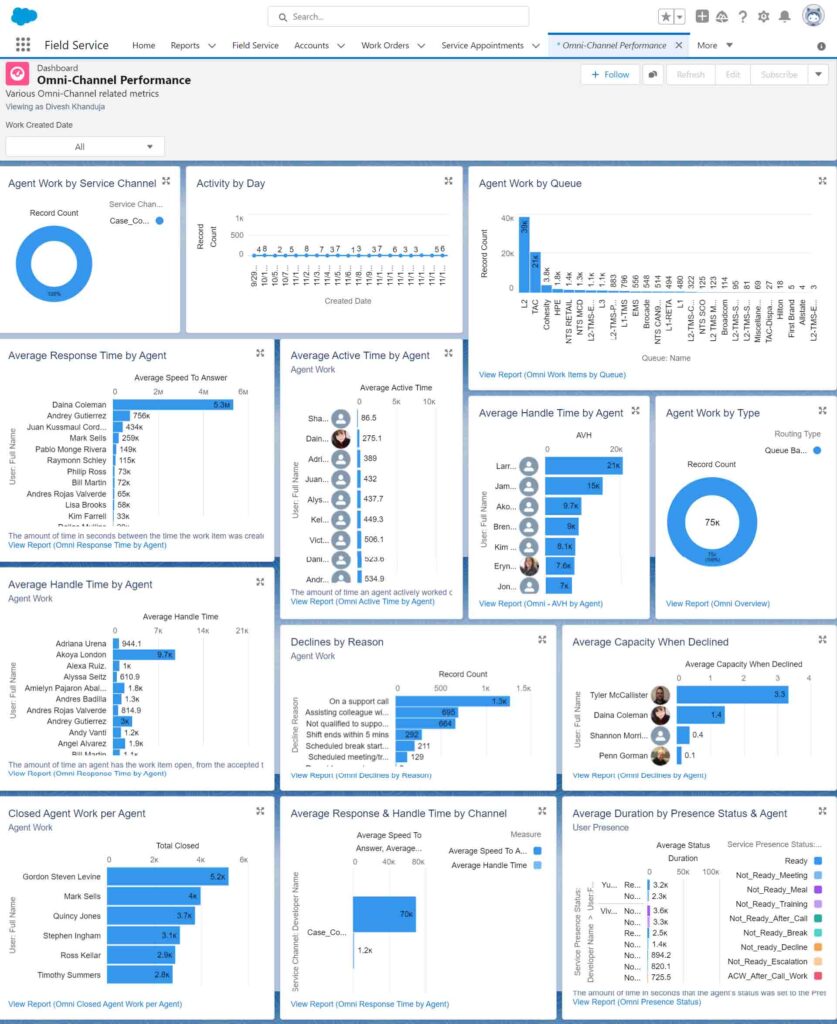
5. Omni Channel Performance Dashboard
Omni-Channel integrates all your support channels, ensuring consistent help for your customers and allowing your agents to operate from a single location. By analyzing their workload, Omni-Channel may assign incoming customer care issues based on agent capability.
To maximize productivity, the Omni-Channel Performance Dashboard evaluates agent job performance. Some of its metrics include:
- Agent work by service channel
- Average response time by the agent
- Average handle time by the agent
Get the FREE eBook

6 Easy Steps to Create a Report in Salesforce Service Cloud
Step 1: Go to app launcher at Salesforce.org
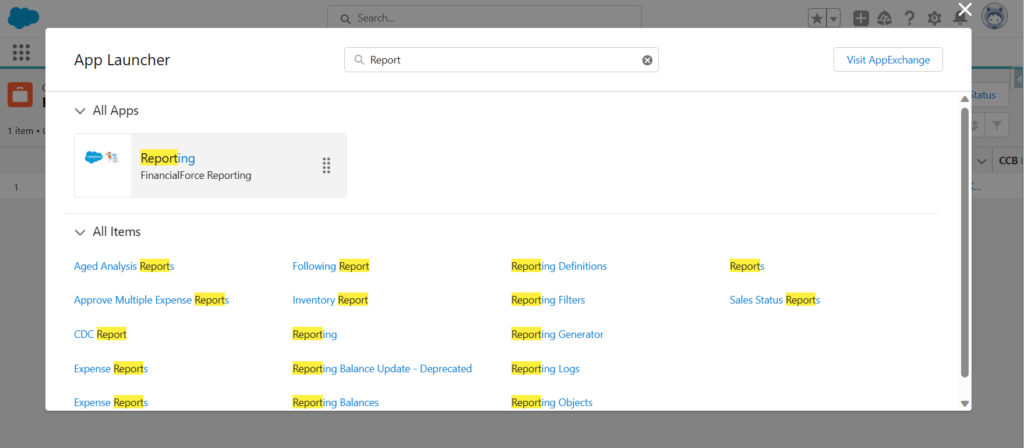
Click on the app launcher in the top left of your Salesforce.org.
Step 2: From the Reports tab, click New Report
To locate a Salesforce Service Cloud report, check in the horizontal navigation bar for the “Reports” object. If this tab does not appear in the bar:
- Examine the objects under the “More” tab;
- Click on “New Report.”
Step 3: Select the report type for the report and click Create
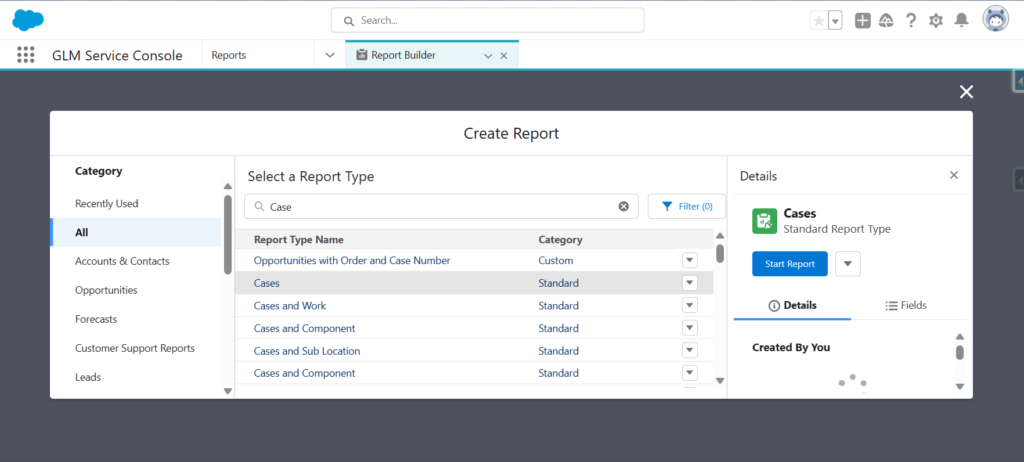
Choose the Salesforce report type & press the “Continue” button. It should be noted that the list of reports is rather extensive, ranging from various sorts of “Accounts”, “Opportunities”, “Deals”, “Cases”, and so on.
Start putting in some keywords to narrow down your search. For instance, if you want a report on your deals, you may click & enter “Deals,” and the relevant outcomes will appear.
Step 4: Filter Your Data
Filtration is a crucial feature if you have large data sets. Click the “Filters” tab to begin choosing the scope of the Service Cloud report using typical Salesforce report filter logic.
Assume you want to restrict reports to just open deals. To do that search, you must:
- Locate the “Status” field and click it.
- Click the “Status” filter type and choose which statuses to display (for example, just open deals status, won, lost, or all).
- Click the “Apply” button.
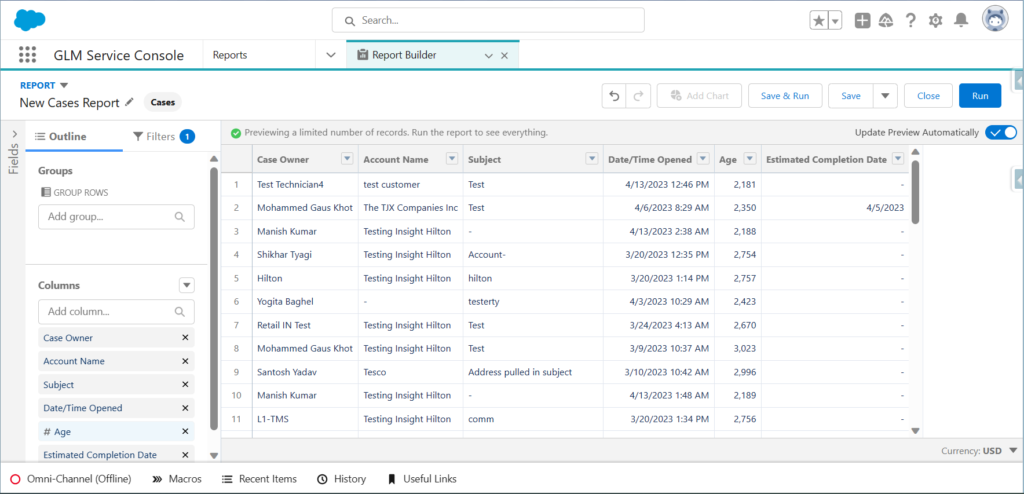
Step 5: Tap the Outline Pane to Display Columns/Fields
You can add as well as delete columns using the “Outline” pane & simple drag-and-drop functionality.
For example, in the report, the Deal name is unlikely to suffice. If you wish to include an estimated closing date, type “Est. Close Date” in the Columns area, and it will filter your results. You can double-click or click & drag the field to the report on the right and to the place you need it.
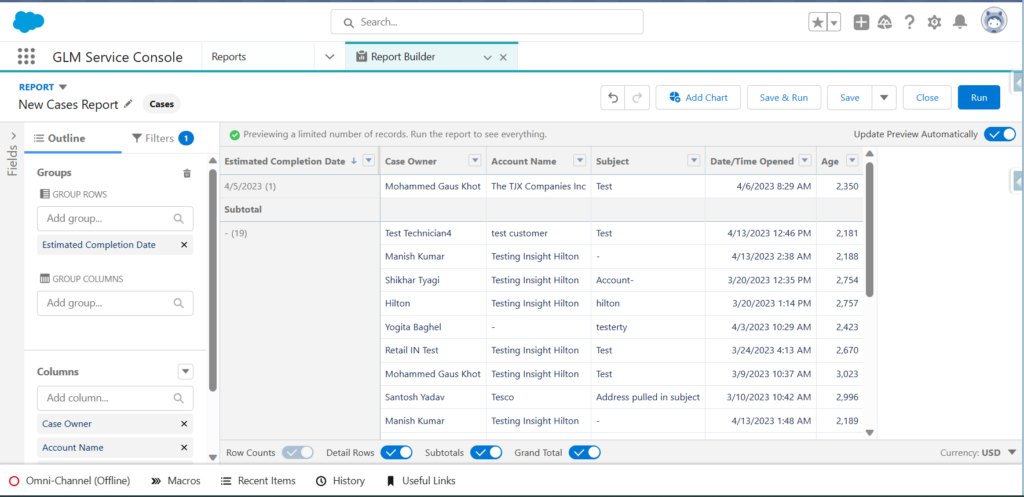
Step 6: Grouping of Your Data
If you want to utilize the expected closing date as a grouping, enter “Est. Close Date” in the “Groups” section, and your results will be sorted appropriately.
When grouping “Deals” by “Est. Close Date,” the data can also be grouped by Day, Calendar Week, Calendar Month, and so on.
Step 7: Customize your report, then save or run it
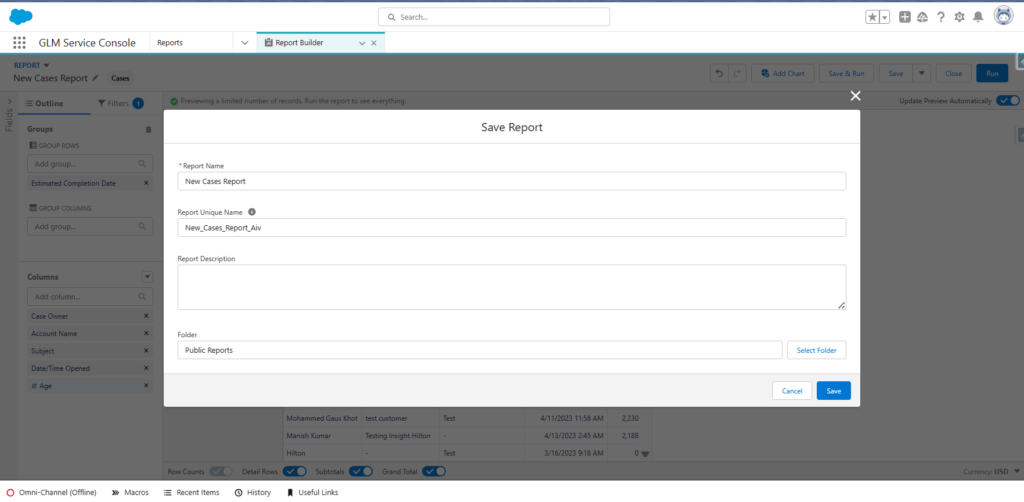
To save your Service Cloud custom report, you must:
- Click the “Save & Run” button.
- Fill out the “Save Report” form by providing a “Report Name,” “Report Unique Name,” and “Report Description.”
- Choose a folder to save your report. You must choose “Private Reports Folder” if you want it to be available only to you. Select “Public Reports Folder” if it should be available to your organization.
- Click the “Save” button.
Improve Service Cloud Reports & Dashboard Performance: 6 Best Practices
When it comes to increasing Service Cloud reports & dashboard performance, following best practices is key. Let’s look at these six strategies that can help optimize your system:
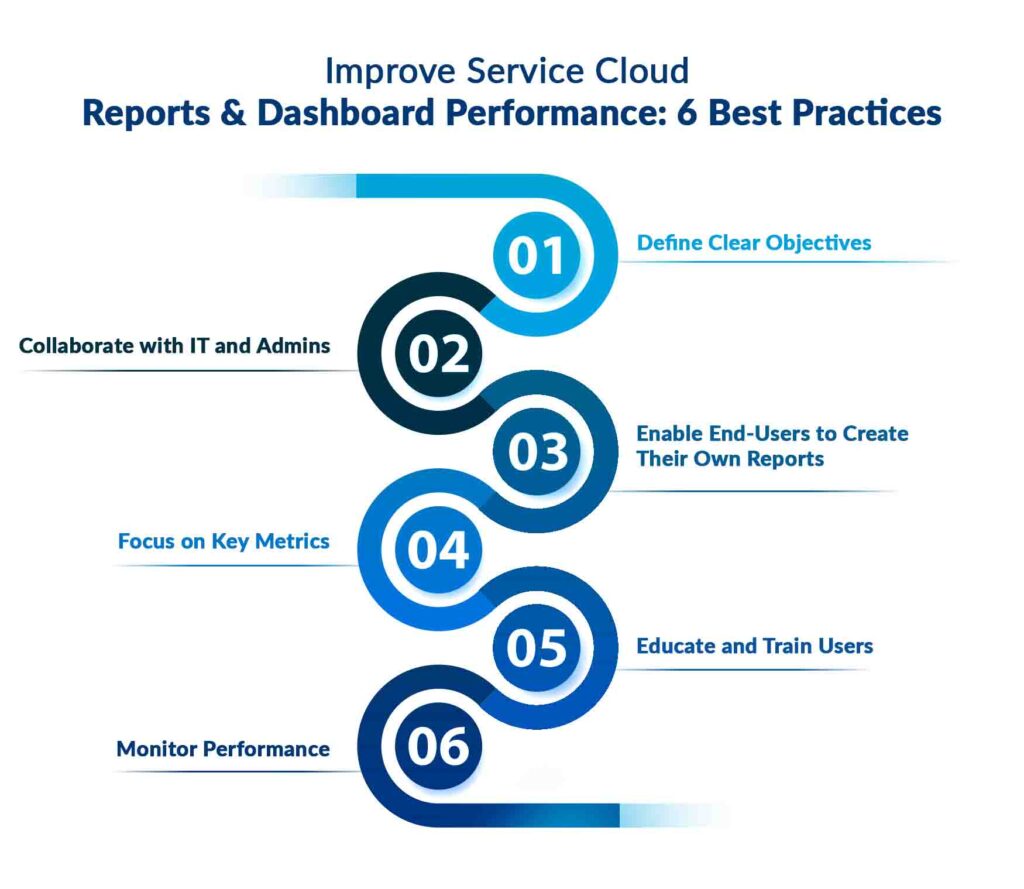
- Define Clear Objectives: Identify the key metrics and insights you need to make informed decisions. Ensure that Service Cloud dashboards and reports align with your specific business goals.
- Collaborate with IT and Admins: Work closely with your IT team and Salesforce administrators to optimize data model, relationships, and indexing for faster data retrieval.
- Empower & enable end-users at all levels of the organization to build their own reports & Service Cloud dashboards: This increases user adoption, fosters greater visibility, and encourages decisions that align to your organizational goals.
- Focus on Key Metrics: Include only essential metrics and insights in your dashboards. Clutter-free dashboards help in quick decision-making.
- Educate and Train Users: Ensure that users understand how to navigate and filter reports effectively to avoid data overload and to find the information they need swiftly.
- Monitor Performance: Regularly monitor report and dashboard performance using Salesforce’s built-in monitoring tools. Identify any bottlenecks and optimize accordingly.
Conclusion
Salesforce Service Cloud Dashboards & Reports help boost customer service agent efficiency as well as the customer experience as a whole. AblyPro will help you personalize your Salesforce Service Cloud dashboard, features, configure tools, and migrate your data seamlessly based on your specific company needs.
Unlock Your Customer Support Success with AblyPro. Book a Meeting Today!
Author

Service Cloud/Field Service Specialist

Ali Zakir is a Salesforce consultant/advocate specializing in Service Cloud and Field Service. With 25 years of experience in IT business management and operations, Ali empowers organizations to go beyond solving complex customer challenges and meeting business requirements.